Sentry Page Protection
Data Analysis [10-15]
Output Data Set
(Proc Means)
The output data set requires special attention when having classification variable(s).
Example
Example
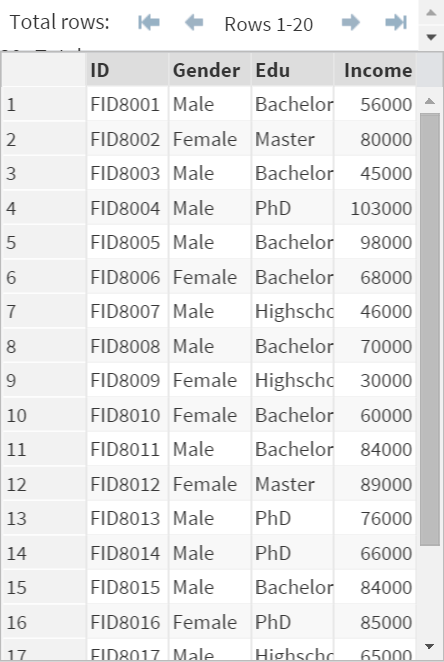
The INCOME data set contains 4 variables:
- FID: ID Number
- Gender: Gender
- Edu: Education
- Income: Income Level
A social researcher wants to find out if gender and education play a role in income discrepancy.
The mean and standard deviation of the population income are computed for male and female at the 4 education levels.
Example
Proc Means Data=Income;
Var Income;
Class Gender Edu;
Output out = Stat Mean=Mean STD=STD;
Run;
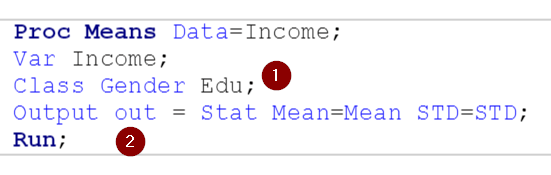
Note: both the GENDER and EDU are listed as the classification variables.
Let's take a look at the output data set:
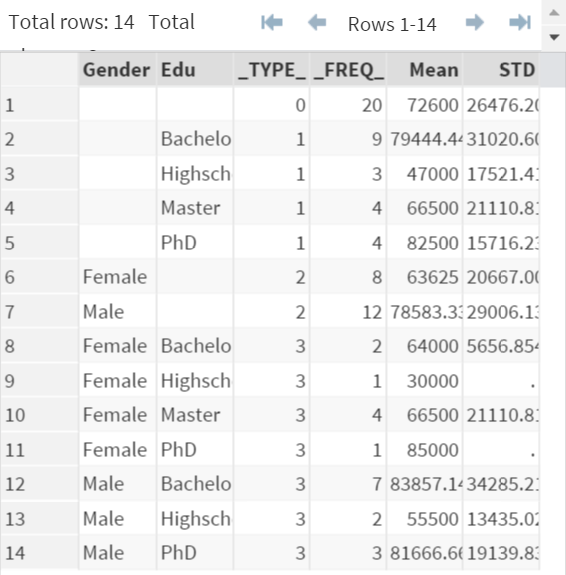
The output data set contains 4 combinations of the classification variables:
(1) _TYPE_ = 0
When _TYPE_ = 0, the statistics are computed without any classification variable.
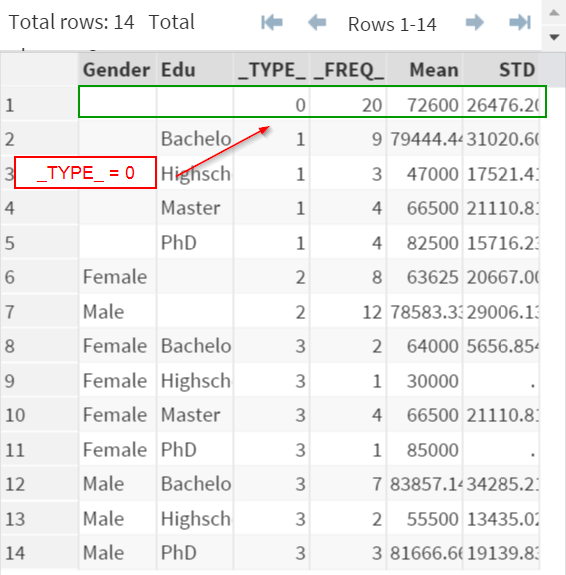
There is only 1 observation showing the overall results for the entire population.
(2) _TYPE_ = 1
When _TYPE_ = 1, the statistics are computed using only Education as the classification variable.
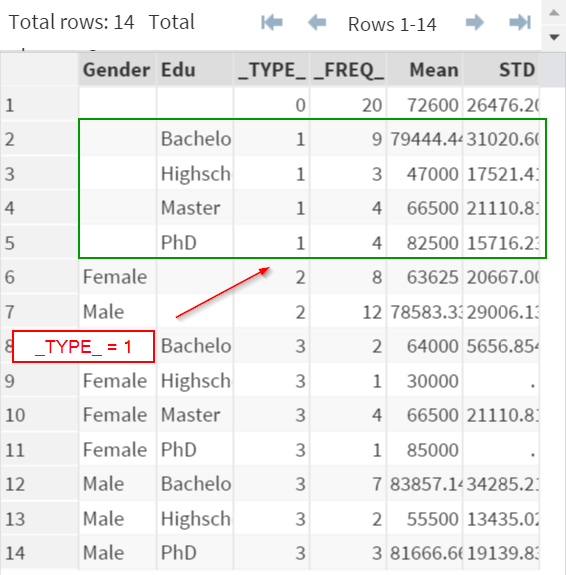
There are 4 observations showing the results for the four education level: Bachelor, High school, Master, and PhD.
Gender is not used in the classification.
(3) _TYPE_ = 2
When _TYPE_ = 2, the statistics are computed using only the Gender as the classification variable.
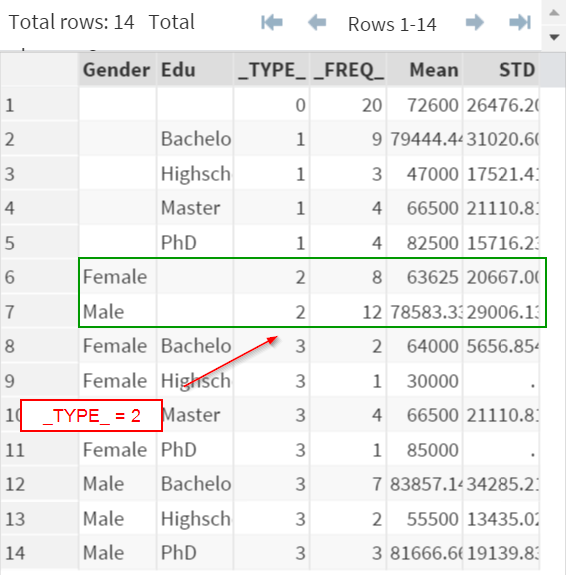
There are 2 observations showing the results for male and female.
Education is not used in the classification.
(4) _TYPE_ = 3
Finally, when _TYPE_ = 3, the statistics are computed by using both the Gender and Education as the classification variables.
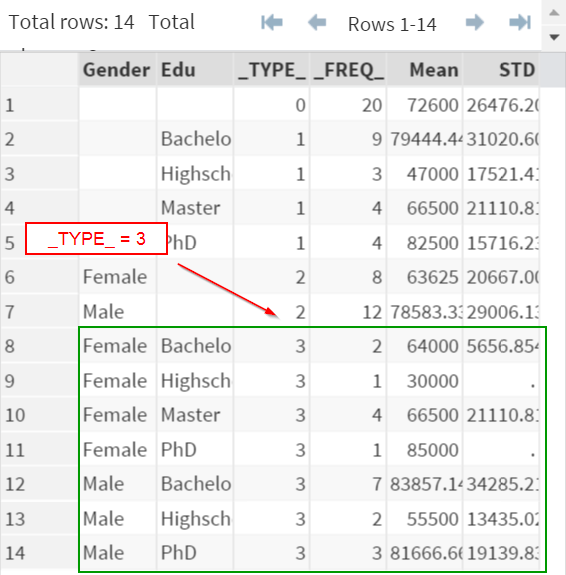
The statistics are computed across all of the classification variables.
The output data set could look very confusing when involving more classification levels.
Pay good attention to the variable _TYPE_ when examining the results!
Exercise
Locate the CARS data set from the SASHelp library.
Compute the Mean and Standard Deviation of Horsepower of the cars, using both the MAKE and TYPE as the classification variables.
Create an output data set for the results.
Locate the CARS data set from the SASHelp library.
Compute the Mean and Standard Deviation of Horsepower of the cars, using both the MAKE and TYPE as the classification variables.
Create an output data set for the results.
Need some help?
HINT:
You might want to subset the data set to include only the classification levels you need.
SOLUTION:
Proc Means Data=SASHelp.cars noprint;
Var Horsepower;
Class Make Type;
Output Out = Cars2 Mean=Mean STD=STD;
Run;
Data Cars3;
Set Cars2;
if _Type_ = 3;
Run;
or
Proc Means Data=SASHelp.cars nway noprint;
Var Horsepower;
Class Make Type;
Output Out = Cars2 Mean=Mean STD=STD;
Run;
Fill out my online form.