Sentry Page Protection
Data Analysis [14-15]
N-way Crosstabulation Table
So far, we have learned how to create a 1-way frequency table that focuses on a single categorical variable.
The n-way crosstabulation table offers insights about the relationship between multiple categorical variables.
Example
The n-way crosstabulation table offers insights about the relationship between multiple categorical variables.
Example
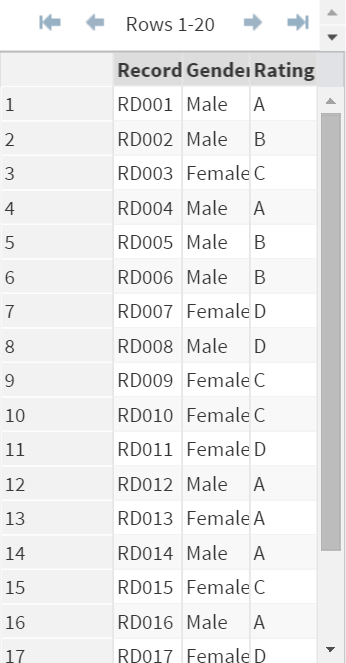
The CS data set contains a list of customer service rating along with the customers' gender.
There are 4 rating options (A, B, C and D).
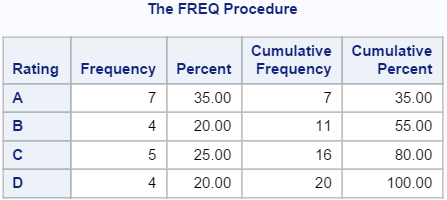
Let's take a look at the frequency distribution of the customer service rating alone.
Example
Proc Freq Data=CS;
Table Rating;
Run;
The rating looks decent. More than 50% of the rating is either A or B.
Now, let's take a look at the result of a 2-way crosstabulation table with Gender and Rating.
Example
Proc Freq Data=CS;
Table Gender*Rating;
Run;
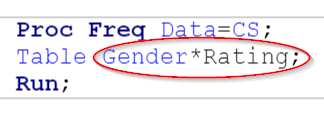
To create the 2-way crosstabulation table, you must add the two variables to the TABLE statement separated by an asterisk.
In our example, the TABLE statement is:
Table Gender * Rating;
This tells SAS to create the crosstabulation table across Gender and Rating:
In our example, the TABLE statement is:
Table Gender * Rating;
This tells SAS to create the crosstabulation table across Gender and Rating:
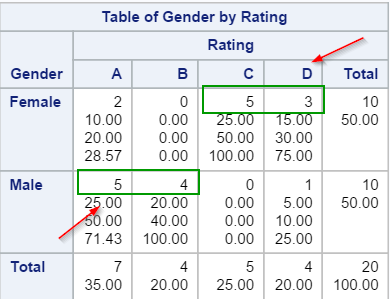
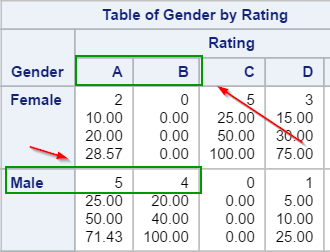
The 2-way table shows the rating statistics across both genders.
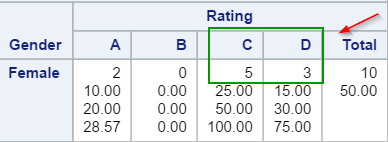
The female customers responded with mostly negative rating, with 5 rated the service a C's and 3 rated a D's.
This is clearly in contrast with the male's rating, where 5 rated a A's and 4 rated a B's.
By looking at the 2-way crosstabulation table, the company might want to invest resources in providing better services to their female customers.
Exercise
Copy and run the TRTMT data set from the yellow box below:
Copy and run the TRTMT data set from the yellow box below:
The TRTMT data set contains the treatment information from a depression study.
Below are the 3 variables in the data set:
- PSID: Patient ID
- Trt: Treatment (Real or Placebo)
- Days: The number of days where the patient had a sleepless night (symptom of stress and depression)
Create a 2-way crosstabulation table across Trt and Days. Briefly describe whether the treatment is more effective than the placebo.
Need some help?
HINT:
The two variables of interest should be placed in the TABLE statement separated by an asterisk ( * ).
SOLUTION:
Proc Freq Data=Trtmt;
Table Trt*Days;
Run;
The patients taking the real treatment does not seem to have better sleep over those taking the placebo.
40% of the treatment group and 50% of the placebo group reported having 2 sleepless nights a week. 90% of the treatment group and 80% of the placebo group have no more than 3 sleepless nights.
The results are quite similar between the two groups.
Is the difference between the two groups statistically significant? This can be answered by the Fisher-exact test, which will be explained in the next module.
Fill out my online form.
