Sentry Page Protection
Data Manipulation [4-18]
Flagging Extreme Values
Sometimes, you might want to flag the extreme values after sorting a data set.
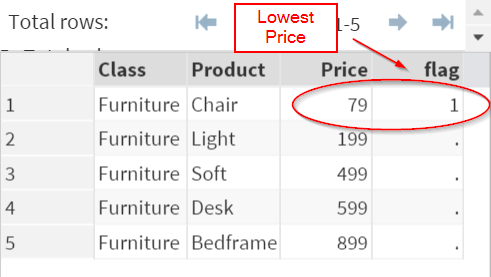
For example, you might want to find the least expensive product after sorting a product list by price.
For example, you might want to find the least expensive product after sorting a product list by price.
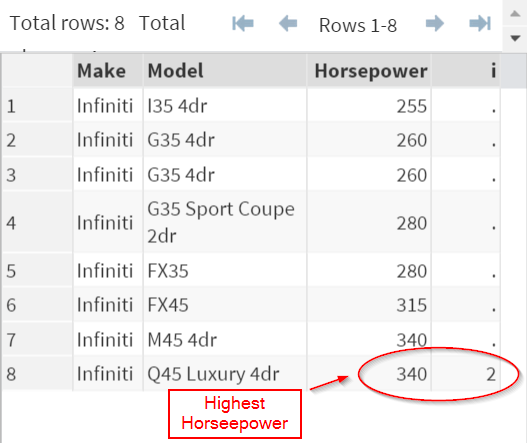
Or you might want to find the most powerful car after sorting the data set by horsepower.
Or you might want to find the most powerful car after sorting the data set by horsepower.
You can do so by using a common SAS programming technique demonstrated below.
Example
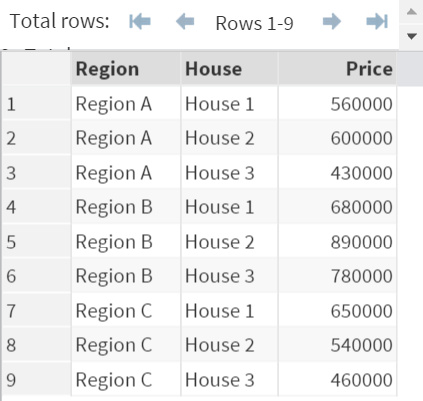
The HOUSE data set above contains 3 variables:
- Region
- House
- Price
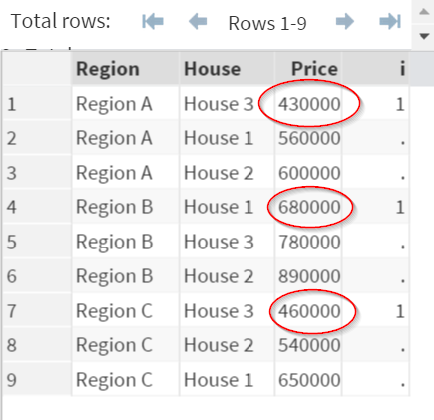
Since the data set is small, you can easily identify the cheapest house in each region.
For example, House 3 is the cheapest house in Region A and it is selling for $430,000.
However, when you have a larger data set, say, 100 observations, identifying the lowest values wouldn't be as easy, if not impossible.
Instead, you can use a special technique that systematically identifies the lowest house price in each region.
Example
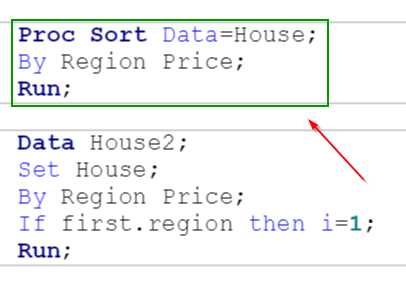
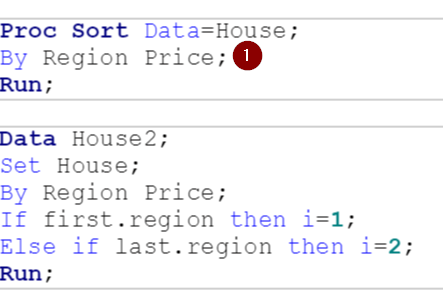
Proc Sort Data=House;
By Region Price;
Run;
Data House2;
Set House;
By Region Price;
If first.region then i=1;
Run;
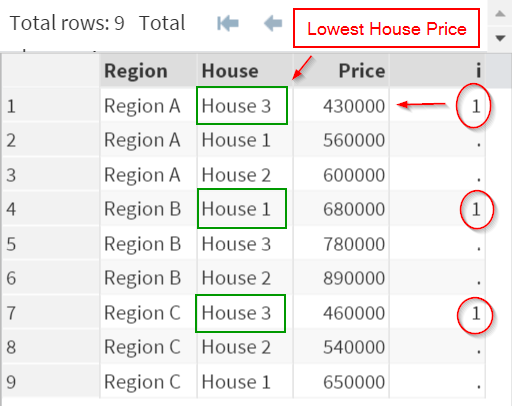
The code systematically flags the house with the lowest price in each region.
When (i=1), the observation is the house that has the cheapest price in the region.
(try it!)
This technique involves two steps:
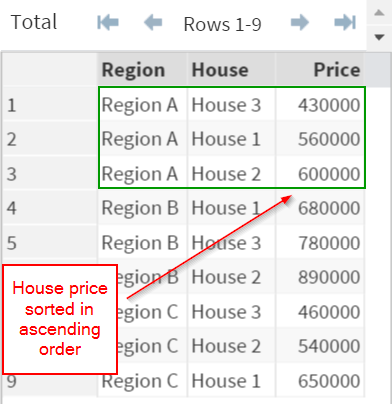
1. The code first sort the data by REGION and PRICE.
1. The code first sort the data by REGION and PRICE.
Within each region, the house price is sorted in ascending order.
2. It then creates a new variable "i" that flags the first observation from each region.
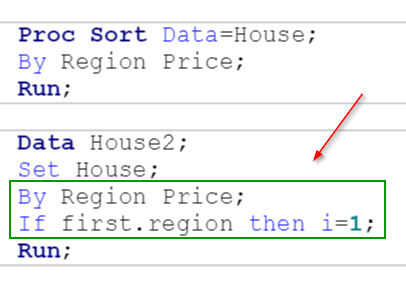
Within each region, the first observation is flagged.
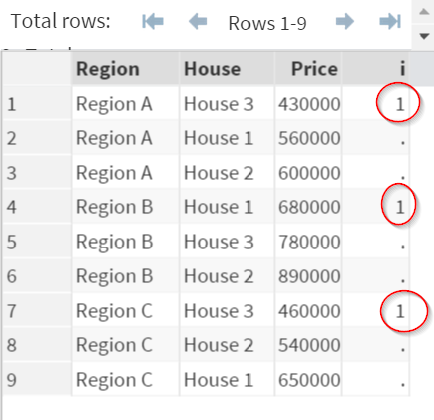
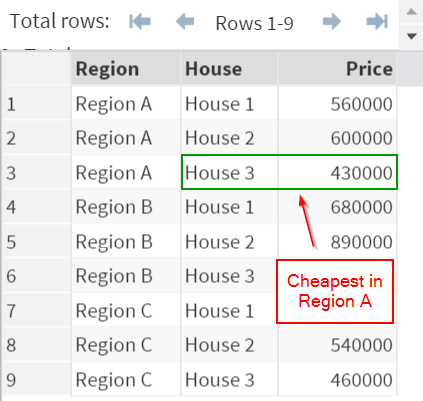
Because the price is sorted in ascending order, the first observation happens to be the one that contains the lowest house price in each region:
(try it!)
The variable i correctly flags the cheapest house in each neighborhood.
Flagging the last observation
Similarly, you can flag the house that has the highest selling price by flagging the last observation from each region.
Example
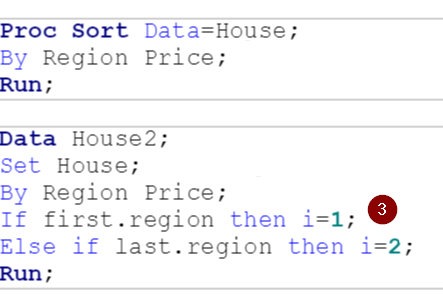
Proc Sort Data=House;
By Region Price;
Run;
Data House2;
Set House;
By Region Price;
If last.region then i=2;
Run;
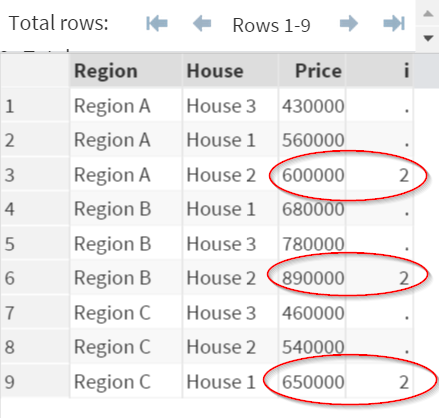
The variable "i" again correctly flags the house with the highest selling price.
Key Requirements
There are 3 key requirements for this technique to work:
Requirement #1:
Data set must be first sorted by the grouping variable(s) and the result variable(s).
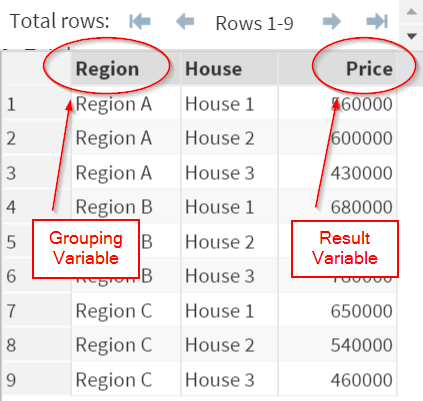
Grouping variable(s) is the variable that defines the groups in the data set.
In our example, the grouping variable is REGION.
Result variable(s) is the variable that determines the order within the grouping variable(s).
In our example, the result variable is PRICE.
Requirement #2:
The data step must include a BY statement with the grouping variable(s) and the result variable(s).

In our example, the data step includes a BY statement with REGION and PRICE.
Note: the BY statement is crucial when using this technique. Without the BY statement, this technique wouldn't work.
Requirement #3:
Use the IF.GROUP condition to identify the first and last observation within the grouping variable (i.e. REGION).
In our example, we have the following conditional statement:
If first.region then i=1;
This tells SAS to flag the observation (i.e. i=1) if it is the very first observation from each region.
Similar for the second conditional statement:
If last.region then i=2;
This tells SAS to flag the observation (i.e. i=2) if it is the last observation from each region.
If first.region then i=1;
This tells SAS to flag the observation (i.e. i=1) if it is the very first observation from each region.
Similar for the second conditional statement:
If last.region then i=2;
This tells SAS to flag the observation (i.e. i=2) if it is the last observation from each region.
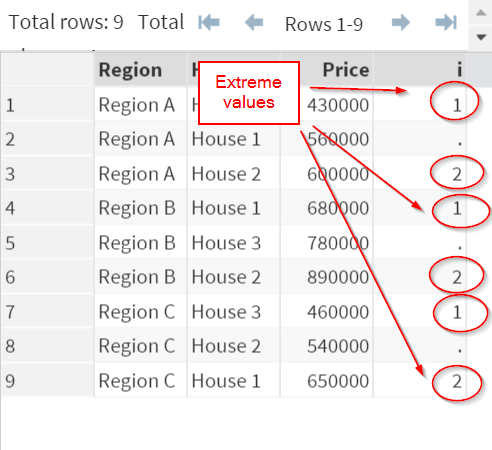
As a result, all of the observations with extreme values (highest and lowest price) are flagged.
Note: use this technique with caution and make sure your code meets all 3 requirements stated above.
Exercise
Locate the FISH data set from the SASHelp library.
Create a new data set that contains only the heaviest fish from each species.
Locate the FISH data set from the SASHelp library.
Create a new data set that contains only the heaviest fish from each species.
Need some help?
Fill out my online form.