Sentry Page Protection
Data Manipulation [4-18]
Flagging Extreme Values
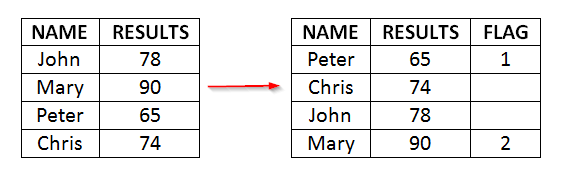
You can also flag extreme values within different groups of data using a special SAS programming technique.
Example
Example
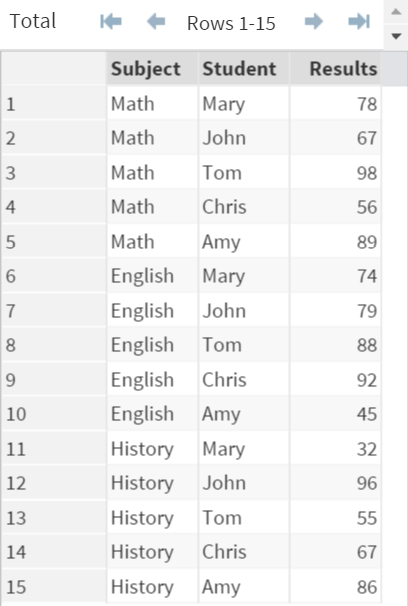
The EXAM data set contains the exam results from 5 students on Math, English and History.
The teacher would like you to identify the best and worst student for each subject.
Example
Proc Sort Data=Exam;
By Subject Results;
Run;
Data Exam2;
Set Exam;
By Subject Results;
if first.subject then i=1;
else if last.subject then i=2;
Run;

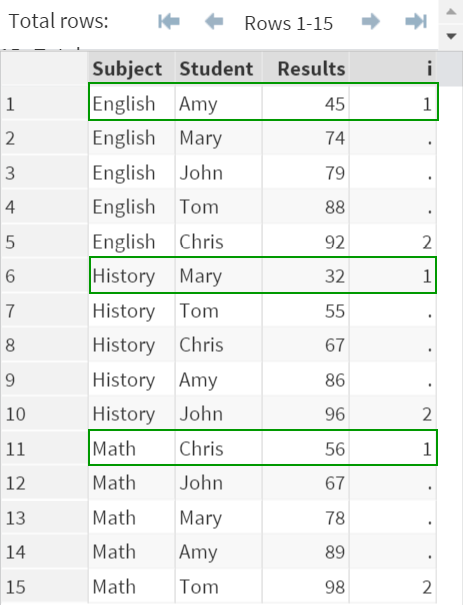
A variable called "i" is created.
The variable "i" flags the students with the highest and lowest results.

Lowest Result (i=1)
The students with the lowest results are Amy (English), Mary (History) and Chris (Math).
The students are all flagged as "1".
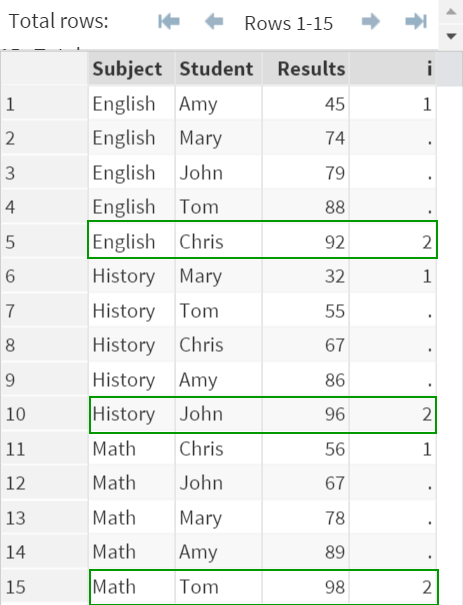
Highest Result (i=2)
Similiarly, the students with the highest results are Chris (English), John (History) and Tom (Math).
They are all flagged as "2".
This technique is useful in identifying the extreme values from a different class of data.
The details of how this technique work will be explained in the next session.
Exercise
Locate the FISH data set from the SASHelp library.
Identify the heaviest fish from each species using the technique covered in this session.
Locate the FISH data set from the SASHelp library.
Identify the heaviest fish from each species using the technique covered in this session.
Need some help?
HINT:
You can't modify the data sets from the SASHelp library. Create an output data set for the results.
SOLUTION:
Proc Sort Data=SASHelp.Fish Out=Fish;
By Species Weight;
Run;
Data Fish2;
Set Fish;
By Species Weight;
if last.species then i=2;
Run;
Fill out my online form.