Sentry Page Protection

Programming Tips 14
How to analyze the correlation coefficient (r)?
The correlation coefficient is always between -1 and 1.
The closer it is to 1 or -1, the stronger the correlation.
Below are some examples of the different correlation coefficient.
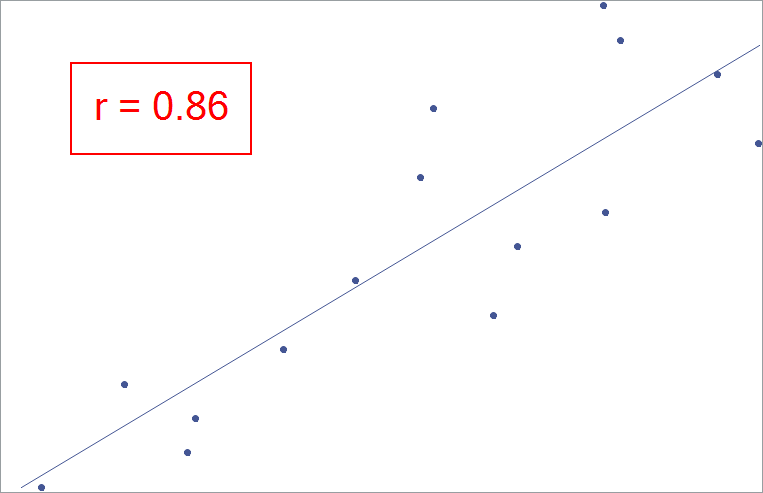
Positive Correlation
Strong Correlation
(0.7 < r ≤ 1.0)
Strong Correlation
(0.7 < r ≤ 1.0)
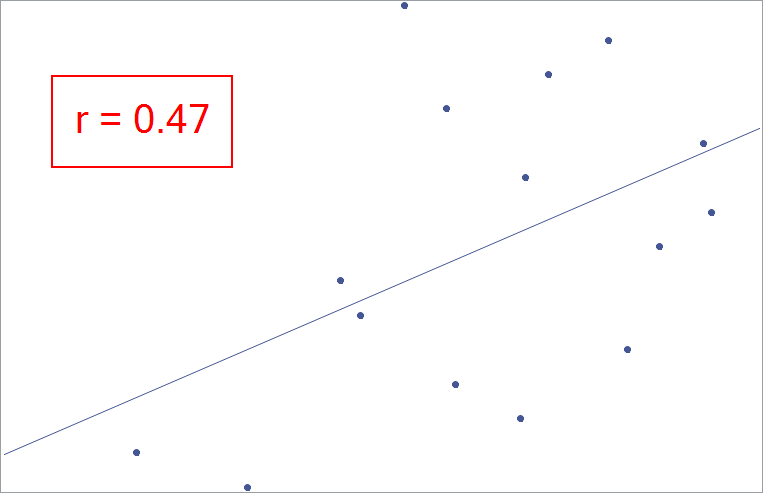
Moderate Correlation
(0.3 < r ≤ 0.7)
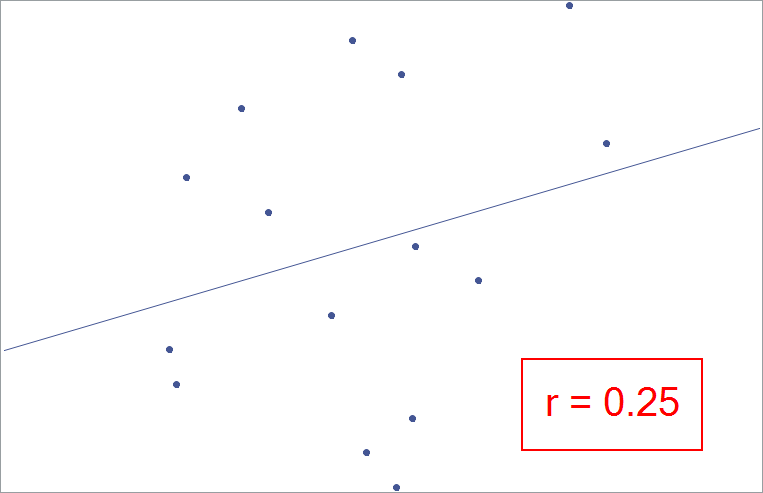
Weak Correlation
(0 < r ≤ 0.3)
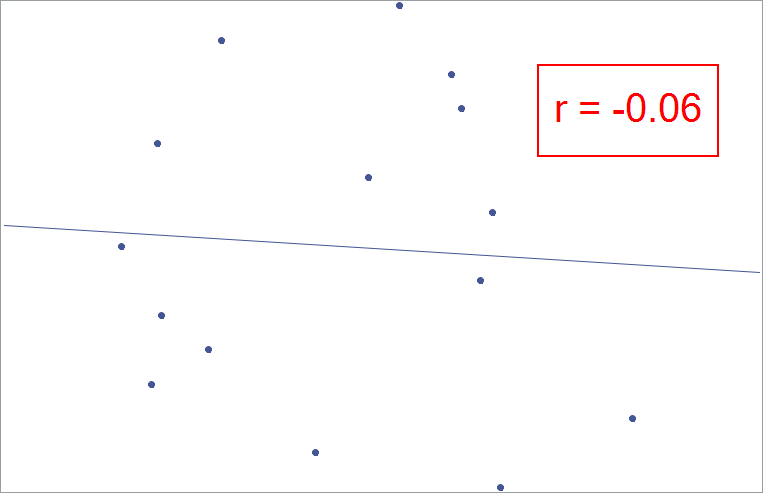
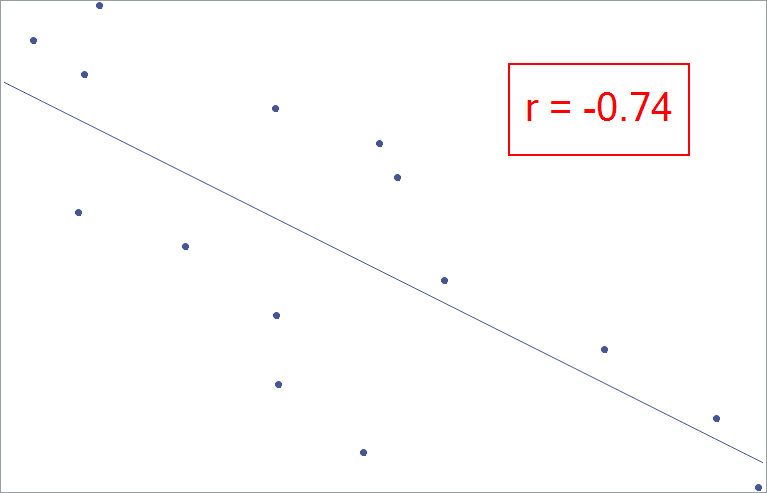
Negative Correlation
Strong Correlation
(-1.0 < r ≤ -0.7)
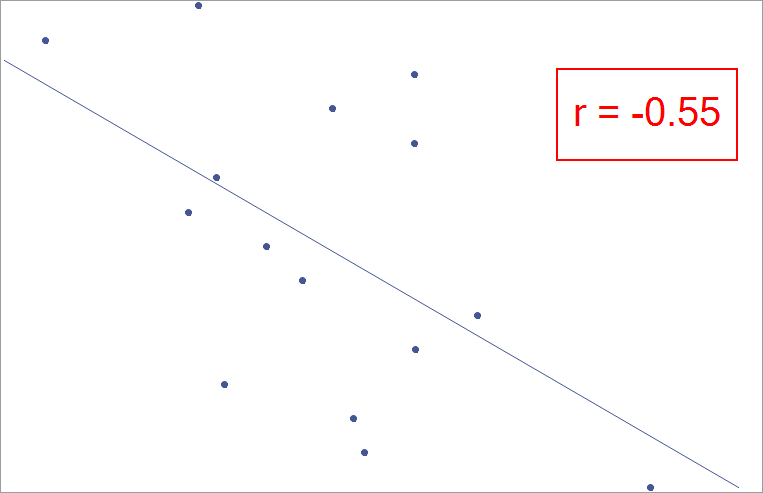
Moderate Correlation
(-0.7 < r ≤ -0.3)
Weak Correlation
(-0.3 < r ≤ 0)