Task [2-4]
The next step to understand the data set is to examine the missing values.
Since the data set is fairly large, it is highly inefficient to check the missing values line by line.
We will use a FORMAT procedure to systematically identify the number of missing values in each columns.
proc format;
value missing
. = 'missing'
other = 'present'
;
value $missing
' ' = 'missing'
other = 'present'
;
run;
value missing
. = 'missing'
other = 'present'
;
value $missing
' ' = 'missing'
other = 'present'
;
run;
The FORMAT procedure creates two formats for missing values: one for numeric variable and another one for character variable.
Once the formats are created, a Proc Freq procedure can be run to find out the proportion of missing values in each columns:
proc freq data=a.online_retail;
tables _all_ /missing;
format _numeric_ missing. _character_ $missing.;
run;
tables _all_ /missing;
format _numeric_ missing. _character_ $missing.;
run;
The FREQ procedure creates eight tables that display the number of missing values in each variables.
Most of the columns have no missing values except for the DESCRIPTION and CUSTOMERID
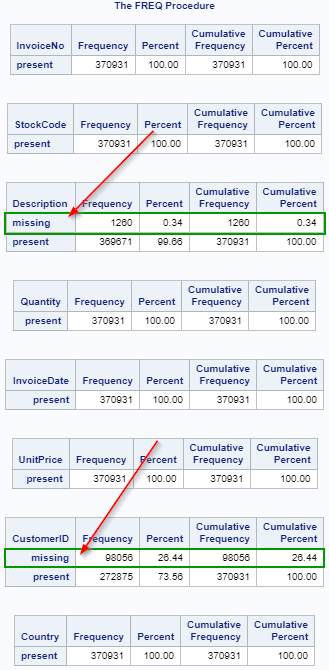
The situation with CUSTOMERID is more alarming as there are almost 100,000 observations missing the customer id.
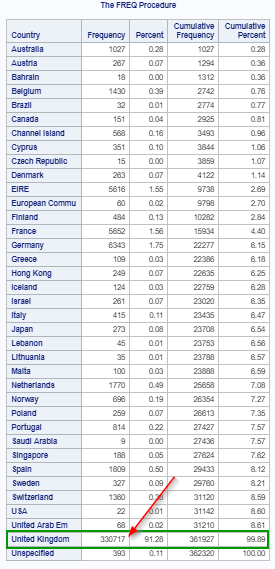
Now, we will also look at the number of purchases by country.
proc freq data=a.online_retail;
tables country;
run;
tables country;
run;
From the table created, we know that most of the sales came from United Kingtom:
Let's also look at the summary statistics for UNITPRICE and QUANTITY sold.
A MEANS procedure is run on the two variables:
proc means data=a.online_retail min max mean median mode maxdec=2;
var unitprice quantity;
run;
var unitprice quantity;
run;
The minimum, maximum, mean, median and mode are computed for the two numeric variables.
Some statistics actually caught our eyes.
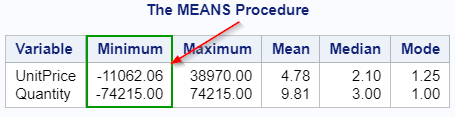
The minimum unit price and quantity are negative.
These are likely due to returns and fraud.
A simple Proc SQL step can be run to identify these observations from the table:
proc sql;
select *
from a.online_retail
where unitprice <0;
select *
from a.online_retail
where quantity <0;
quit;
select *
from a.online_retail
where unitprice <0;
select *
from a.online_retail
where quantity <0;
quit;
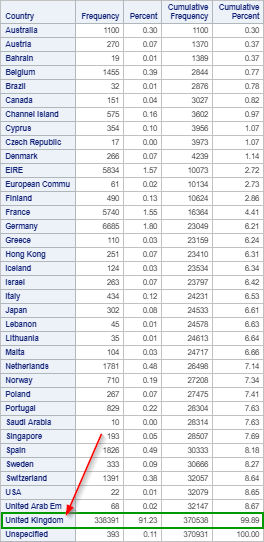
Now, we will re-run the analysis for purchases by country without the records where the unit price or quantity are negative.
proc freq data=a.online_retail;
tables country;
where unitprice >0 and quantity >0;
run;
tables country;
where unitprice >0 and quantity >0;
run;
Overall, United Kingdom is still the country where most sales are generated: