Sentry Page Protection
SAS Functions [4-14]
RAND Function
You can use the RAND function to create random values based on a pre-specified distribution.
In this session, the examples are based on a TEMPLATE data set:
[Note: Copy and run the code in the yellow box below before going through the examples.]

Example
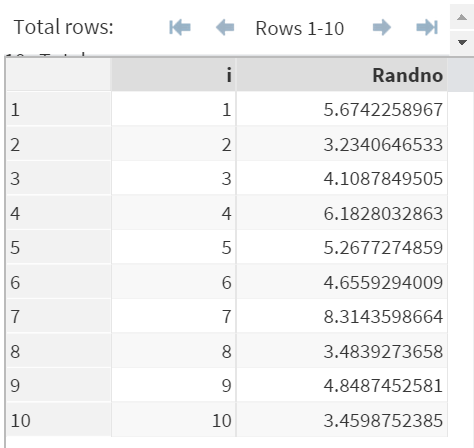
1. Uniform Distribution
Data Rand1;
Set Template;
Randno = RAND('uniform');
Run;
Set Template;
Randno = RAND('uniform');
Run;
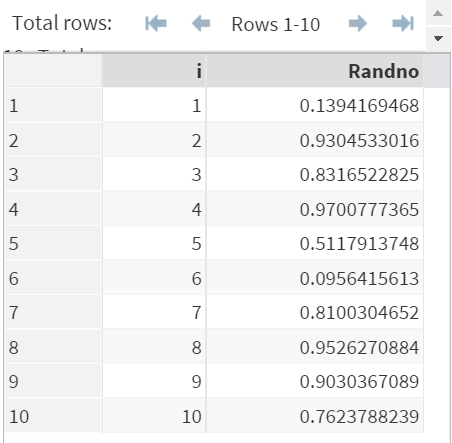
The RAND function above creates a list of random values based on the uniform distribution.
The values from a uniform distribution will be between 0 to 1.
(Try it! You might get some totally different values but it is totally normal.)
You can also use other distributions such as Bernoulli and Binomial distributions to generate the random values as well.
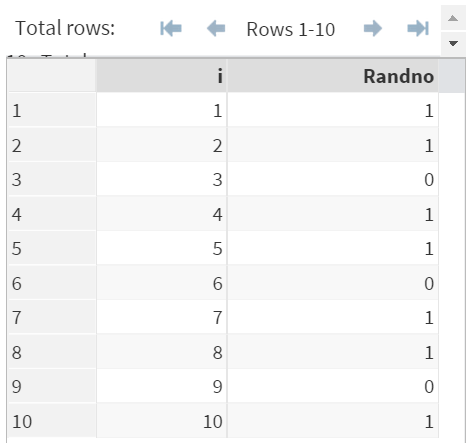
2. Bernoulli Distribution
Example
Data Rand2;
Set Template;
Randno = RAND('bernoulli', 0.7);
Run;
*The second parameter is p (probability of success).
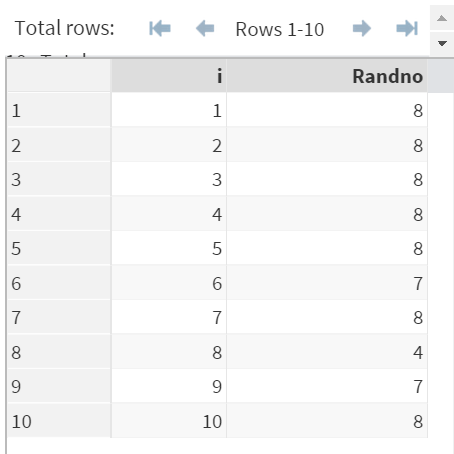
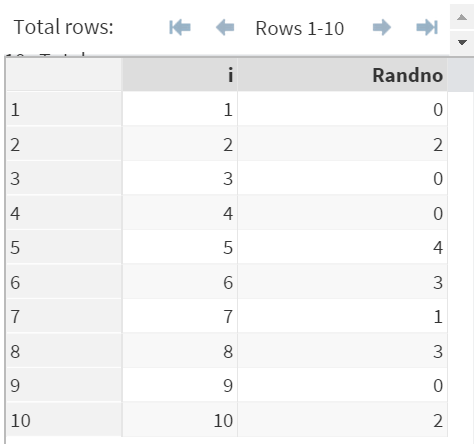
3. Binomial Distribution
Example
Data Rand3;
Set Template;
Randno = RAND('binomial', 0.7, 10);
Run;
*The second parameter is p ( probability of success). The third parameter is n (number of independent Bernoulli trials).
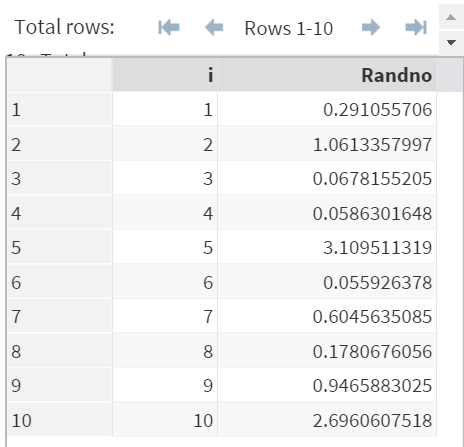
4. Exponential Distribution
Example
Data Rand4;
Set Template;
Randno = RAND('exponential');
Run;
5. Normal Distribution
Example
Data Rand5;
Set Template;
Randno = RAND('Normal', 5, 1.5);
Run;
*The second and third parameters are mean and standard deviation, respectively.
6. Poisson Distribution
Example
Data Rand6;
Set Template;
Randno = RAND('poisson', 2);
Run;
*The second parameter is m (numeric mean parameter).
Exercise
Background (optional)
You have played fantasy basketball for a number of years.
You are getting sick of the 'Experts' giving you inaccurate predictions years after years.
You are going to do your own prediction this year using SAS.
Task
Copy and run the STAT data set from the yellow box below.
Background (optional)
You have played fantasy basketball for a number of years.
You are getting sick of the 'Experts' giving you inaccurate predictions years after years.
You are going to do your own prediction this year using SAS.
Task
Copy and run the STAT data set from the yellow box below.

STAT contains 3 variables:
- PLAYER: The player being analyzed
- STAT: The statistics (points, rebounds, assists, blocks and field goals percentage)
- CURRENT: The current statistics from said player
Now, you are going to predict the player's statistics for next season based on a random factor.
The random factor should be a value between 0.9 to 1.1.
You can generate the random factor based on a UNIFORM distribution.
The prediction statistics will be calculated as:
Pred = Curr x Random Factor
Write a SAS program to calculate the stat prediction for said player. Create any data set or variables if necessary.
Need some help?
HINT:
First, create the random factor based on a Uniform distribution. Adjust the range of the value to 0.9 to 1.1. Multiply the current stat by the random factor to get the predictions.
SOLUTION:
Data Pred;
Set Stat;
factor = rand('uniform')*0.2 + 0.9;
Pred = Current * factor;
Run;
Fill out my online form.