Sentry Page Protection
Statistical Analysis [4-7]
Two-sample t-test
A two-sample t-test can be used to compare the means of two independent population.
Example of application of two-sample t-test:
Example
Example of application of two-sample t-test:
- Compare the treatment efficacy between the treatment and placebo group
- Compare the effectiveness of a marketing campaign on two groups of customer
- Compare the income inequity between the two gender
Example
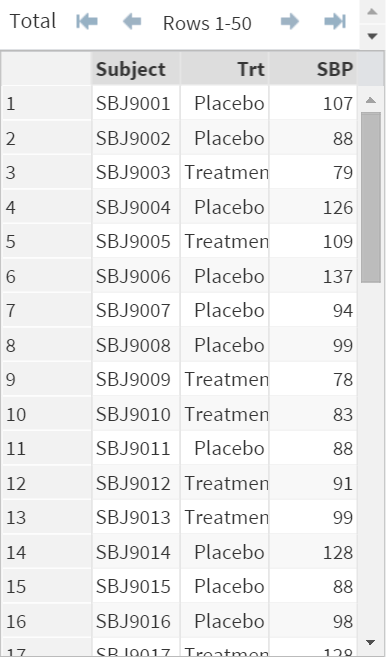
A biostatistician is hoping to find out if a newly developed treatment raised the systolic blood pressure (mmHg) on the targeted patients.
A study has been conducted to compare the systolic blood pressure on both the treatment group and the placebo group.
The data is captured in the VITAL data set.
Let's take a look at how you can compare the means of the systolic blood pressure between the two groups of patient.
Example
Proc ttest Data=Vital;
Class Trt;
Var SBP;
Run;
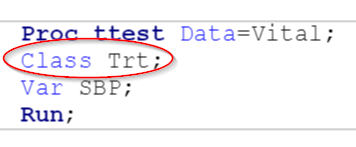
The CLASS statement is used to identify the two populations for the two-sample t-test.
The following results are generated:
1. Summary statistics and confidence limits for the two populations
The following results are generated:
1. Summary statistics and confidence limits for the two populations
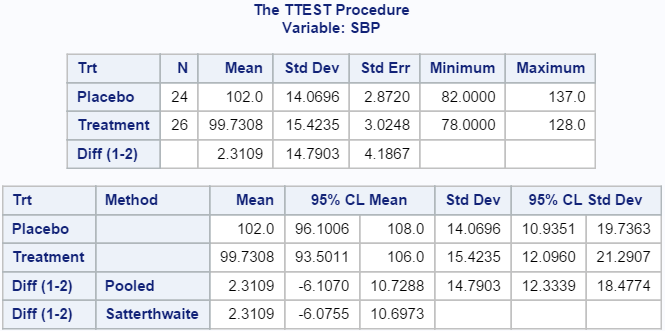
The mean SBP (Systolic blood pressure) is 99.7 and 102 for the treatment group and the placebo group, respectively, with the two groups having a fairly close standard error (2.87 vs. 3.02).
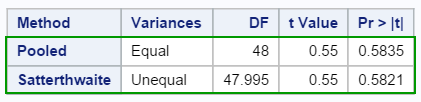
2. P-value for Pooled and Satterthwaite methods
Important!
There are two p-values computed when performing two-sample t-test:
- 0.5835 (Pooled Method)
- 0.5821 (Satterthwaite Method)
Which p-value should be used?
That depends on whether the two populations have an equal variance.
If the two populations have an equal variance, use the pooled method; Otherwise, use the Satterthwaite method.
How to tell if the variances are equal?
Proc ttest actually computed the equality of variance test result.
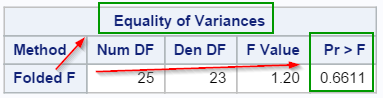
H0: σ²1 = σ²2
H1: σ²1 ≠ σ²2
The p-value for the equality of variances test is 0.6611, which fails to reject the hypothesis that the variances are equal.
As a result, the p-value from the Pooled method (0.5835) should be used.
3. Histogram and Q-Q Plot
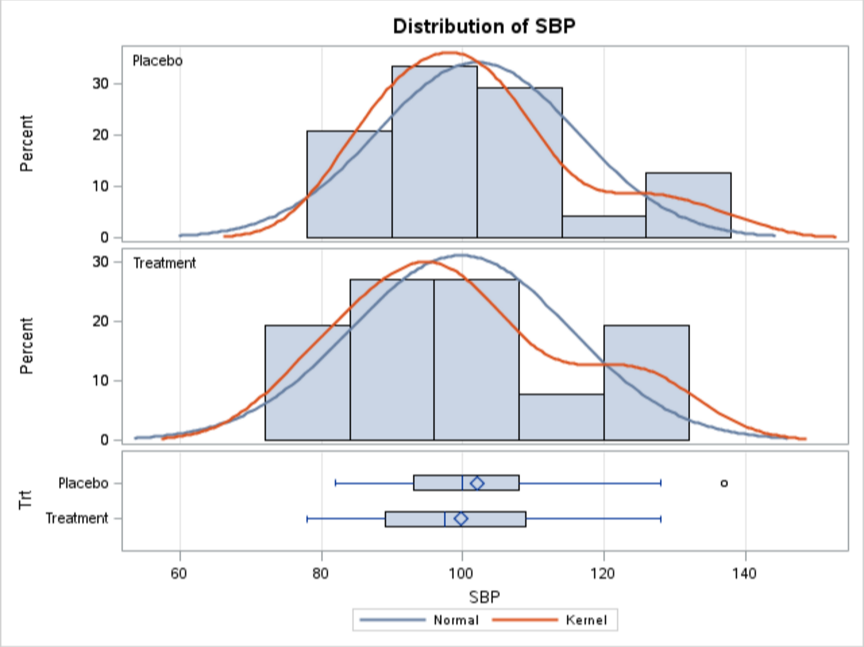
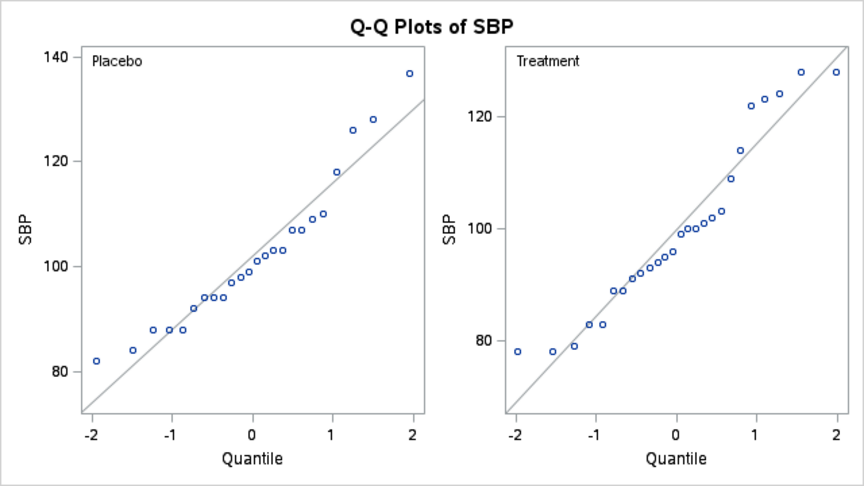
Some of the related graphs such as the histogram and the Q-Q plot are also plotted.
One of the main assumptions for paired t-test is that the difference should be approximately normally distributed.
The linear pattern from the q-q plot suggests the difference follows a normal distribution reasonably well.
Exercise
Copy and run the CAMPAIGN data set from the yellow box below:
Copy and run the CAMPAIGN data set from the yellow box below:
A marketing campaign has been launched for a premium retail outlet.
During this campaign, a segment of their regular customer has been divided into two groups.
Group 1 received a giftcard of $100 and Group 0 did not receive any giftcard.
An analyst is hoping to find out if the campaign is effective or not, by comparing the purchase behavior between the two groups.
Conduct a two-sample t-test and find out if the purchases from one group significantly differs from the other.
Need some help?
HINT:
The Group variable should be used as the classification variable.
SOLUTION:
Proc ttest data=campaign;
class group;
var purchase;
run;
The p-value (either Pooled or Satterthwaite) at 0.8273. There is not sufficient evidence that the purchase from one group significantly differs from the other group.
Fill out my online form.