Sentry Page Protection
Task 2
A premium clothing store is looking to launch a loyalty/coupon marketing campaign.
Before they launch a full-scale coupon campaign, the marketing department has decided to do a simple experiment.
It classifies their current customers by the following:
Recency:
This is how recently they have made a purchase.
This could be 1, 2, 3, 4, 5 or 6+ months.
Frequency:
This is how many times they have made a purchase within the year past.
This could be once, twice, 3, 4, 5 or 6+ times.
For each classification group, 10% of the customers are randomly selected.
These 10% of the customers are divided into two groups:
One group received a $50 coupon (GROUP=2) and the rest did not receive anything (GROUP=1).
Their spending within 3 months after the start of the experiment is tracked (SPENT).
Write a SAS program to create a data set that contains the classification groups that respond well to the coupon, the mean difference in spending and the p-value from the hypothesis testing.
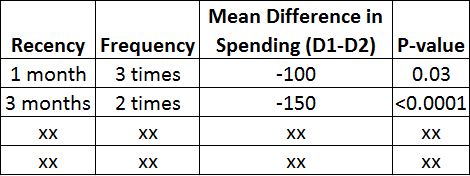
The data set should look like the following:
A premium clothing store is looking to launch a loyalty/coupon marketing campaign.
Before they launch a full-scale coupon campaign, the marketing department has decided to do a simple experiment.
It classifies their current customers by the following:
Recency:
This is how recently they have made a purchase.
This could be 1, 2, 3, 4, 5 or 6+ months.
Frequency:
This is how many times they have made a purchase within the year past.
This could be once, twice, 3, 4, 5 or 6+ times.
For each classification group, 10% of the customers are randomly selected.
These 10% of the customers are divided into two groups:
One group received a $50 coupon (GROUP=2) and the rest did not receive anything (GROUP=1).
Their spending within 3 months after the start of the experiment is tracked (SPENT).
Write a SAS program to create a data set that contains the classification groups that respond well to the coupon, the mean difference in spending and the p-value from the hypothesis testing.
The data set should look like the following:
Purpose of the project
This project is highly practical.
It allows you to identify the groups of customers who are likely to respond well to the marketing campaign.
For example, let's assume the following is a part of the data set:
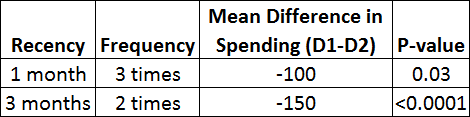
The first line of the table represents the customers who made a purchase within 1 month and made 3 purchases in the year past.
When being given a $50 coupon, this group of customers spend on average $100 more than those without the coupon.
The difference is statistically significant (p-value = 0.03).
This is great because the marketing department can target only these customers and expect to make a return with 95% certainty.
This is a great way to ensure the marketing campaign will be profitable before a full-scale campaign is launched.
Submit your program below:
Fill out my online form.