Sentry Page Protection
Simple Linear Regression [1-17]
Simple Linear Regression
Simple linear regression is a statistical modeling technique that explores the relationship between variables.
It allows you to make a more accurate prediction on the response variable by using the associated predictor variable.
Let's look at an example.
Copy and run the code from the yellow line below:
It allows you to make a more accurate prediction on the response variable by using the associated predictor variable.
Let's look at an example.
Copy and run the code from the yellow line below:
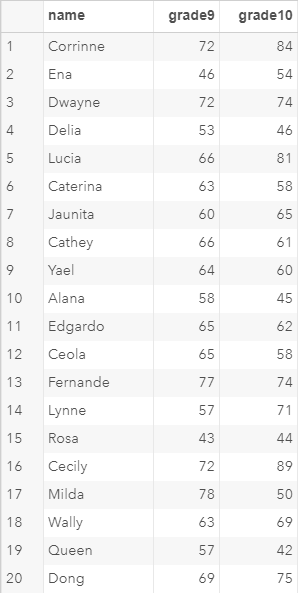
The SCHOOL data set contains a list of 20 students and their English class results in grade 9 and grade 10.
Mary is a new student joining the grade 10 class.
She hasn't started grade 10 yet. However, her English teacher asked you to help predict her performance in the English class.
You were given no information about Mary. You don't know her age, IQ and how she did in grade 9.
How are you going to make the prediction?
Without much information about Mary, the best estimate you can get is to calculate the average grade 10 result in the current English class.
Let's run a Proc Means to find out the average performance of the grade 10 English class.
Example
proc means data=school mean;
var grade10;
run;
var grade10;
run;
The MEANS procedure computes the mean grade 10 result which is 63.1.
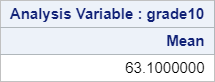
On average, a grade 10 student achieved 63.1 in the English class.
You then predict that Mary will achieve just the average (i.e. 63.1) in the class.
Although you don't believe this is an accurate prediction, this is the best that you can do without much information about Mary.

Now, let's suppose you are told that Mary had achieved 70 in her grade 9 English class.
You believe a student's past performance is a good indicator their future performance.
You sorted the data set and look for the other students who achieved close to 70 in grade 9:
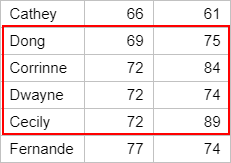
Dong, Corrinne, Dwayne and Cecily all achieved close to 70 in grade 9. Their grade 10 results range from 74 to 89.
With these information in mind, you predicted that Mary is also likely to achieve a result that is between 74 to 89 in grade 10.
This is much different than the 63.1 result that you have originally estimated.
Which estimate is likely to be more accurate?
Logically, the second estimate is likely to be more accurate.
You made use of the information about Mary's grade 9 result to make the prediction.
If the students' grade 9 and grade 10 results are correlated, using the grade 9 result should help predicting the performance in grade 10.
Logically, the second estimate is likely to be more accurate.
You made use of the information about Mary's grade 9 result to make the prediction.
If the students' grade 9 and grade 10 results are correlated, using the grade 9 result should help predicting the performance in grade 10.
Simple linear regression works in a similar way but takes a step further.
It formulates an equation that best represents the relationship between the grade 9 and grade 10 results.
E.g.
Grade10 = a + b * Grade9
You then perform a hypothesis testing to find out whether the grade 9 result is a good indicator of the grade 10 performance.
By evaluating and validating the equation parameters (i.e. model), you will be able to make a better prediction on how the student perform in grade 10.
In the next few sections, we will go through the necessary steps to build your first regression model.
Exercise
John is also a new student in grade 10. He achieved 60 in his English class when he was in grade 9.
What would be your best estimate of his result in the English class in grade 10?
You can sort the SCHOOL data set using the code below:
proc sql;
select * from school
order by grade9;
quit;
John is also a new student in grade 10. He achieved 60 in his English class when he was in grade 9.
What would be your best estimate of his result in the English class in grade 10?
You can sort the SCHOOL data set using the code below:
proc sql;
select * from school
order by grade9;
quit;
Need some help?
Fill out my online form.