Sentry Page Protection
Statistical Analysis [1-7]
One-sample t-test
A one-sample t-test can be used to test whether the sample mean is significantly different than a hypothesized value.
Example
Copy and run the CHIPS data set from the yellow box below.
Example
Copy and run the CHIPS data set from the yellow box below.
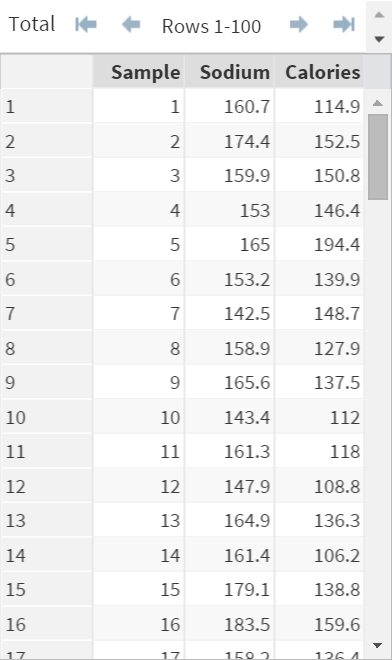
The CHIPS data set contains 100 chips samples taken from ABC-branded chips.
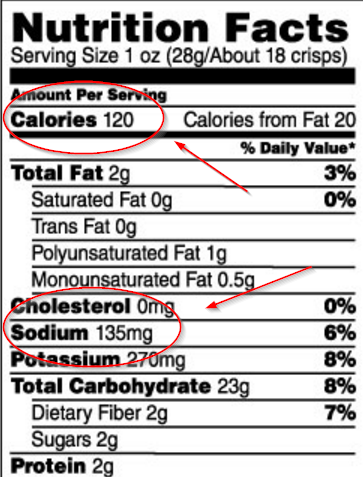
On the nutrition label, the chips are shown to have 120 calories.
An inspection agency has randomly collected 100 chips samples to test whether the nutrition label shows the correct calories information.
A one-sample t-test is used to test the following hypothesis:
H0: µ=120
H1: µ≠120
where µ is the true and unknown chips calories.
The hypothesis testing can be performed using Proc ttest:
Example
Proc ttest Data=Chips H0=120;
Var Calories;
Run;
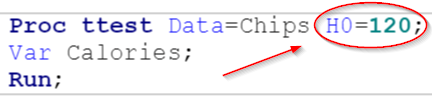
The H0 option specifies the hypothesized value to be tested.
The following results are generated:
1. Sampling Distribution
The following results are generated:
1. Sampling Distribution
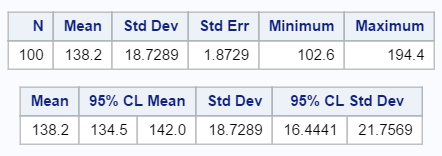
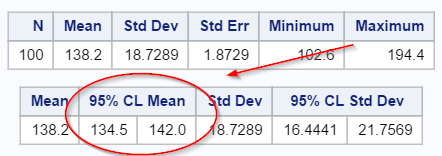
The first two table shows the sampling distribution of sample mean such as mean, standard error and confidence limits.
The sampling distribution (of sample mean) has a mean of 138.2 and a standard error of 1.8729.
The 95% confidence limit is 134.5 to 142.
We can reject the null hypothesis since the 95% confidence interval does not contain the hypothesized value of 120.
2. T-value and P-value
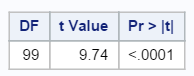
The third table shows the t-value and p-value.
The p-value is less than 0.05.
This rejects the null hypothesis that the mean calories is 120.
3. Histogram, box plot, and Q-Q plot
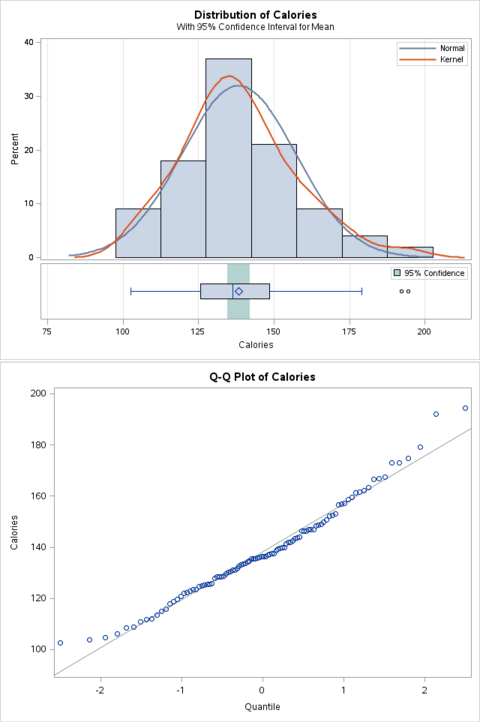
One of the main assumptions for one-sample t-test is that the dependent variable (i.e. calories) should be approximately normally distributed.
All the plots indicate the data is normally distributed.
What does the result mean?
The null hypothesis is rejected as the p-value is below 0.05.
There is sufficient evidence to reject the claim that the mean calories is 120.
The 95% confidence interval is [134.5, 142].
We are 95% certain the true mean calories is within this range.
The nutrition label is unlikely to be correct.
Exercise
The nutrition label also shows 135 mg of sodium in one serving.
Perform a one-sample t-test on whether the nutrition label shows the correct sodium information.
The nutrition label also shows 135 mg of sodium in one serving.
Perform a one-sample t-test on whether the nutrition label shows the correct sodium information.
Need some help?
HINT:
The same one-sample t-test can be used to test the sodium information.
SOLUTION:
Proc ttest Data=Chips H0=135;
Var Sodium;
Run;
The p-value is again below 0.05. There is sufficient evidence to reject the hypothesis that 1 serving of chips contains 135 mg of sodium.
Fill out my online form.