Sentry Page Protection
Statistical Analysis [6-7]
Chi-square Test of Independence
The Chi-square test is used when examining the association and difference between two categorical variables.
Example of application of chi-square test:
Example
Example of application of chi-square test:
- Compare the smoking behavior between Male and Female
- Compare education level by different race group
- Compare the voting preference by income level
Example
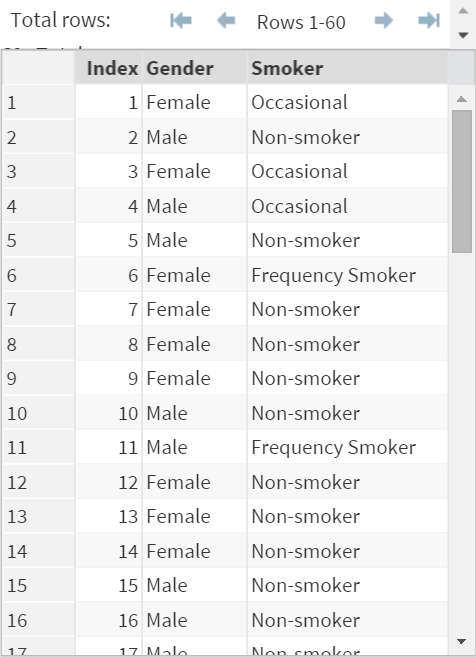
The SMOKE data set contains a list of survey participants on their smoking behavior.
The data set has 40 observations with information about the gender (Male vs. Female) and the 3 types of smoker:
- Non-smoker
- Occasional (<=5 per week)
- Frequent (>5 per week)
A research on the smoking behavior has been conducted to find out whether men smoke significantly more than women.
The following hypothesis is being tested with the chi-square test:
H0: Smoking behavior is independent of gender
H1: Smoking behavior is dependent on gender
Example
Proc Freq Data=Smoke;
Table Gender * Smoker / Chisq;
Run;
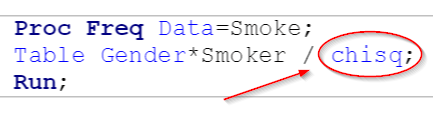
A chi-square test can be done by using Proc Freq with the CHISQ option.
Run the code on SAS Studio and the following results will be generated:
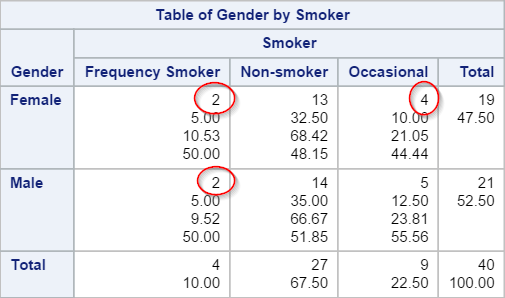
1. Two-way Crosstabulation Table
Run the code on SAS Studio and the following results will be generated:
1. Two-way Crosstabulation Table
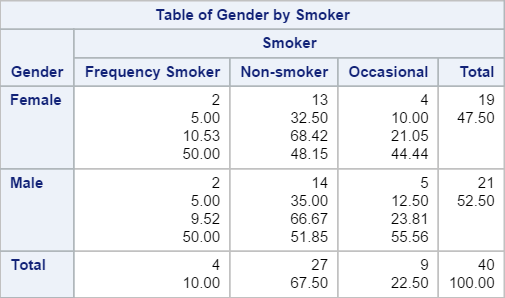
The standard two-way crosstabulation table is created showing the counting statistics from each category.
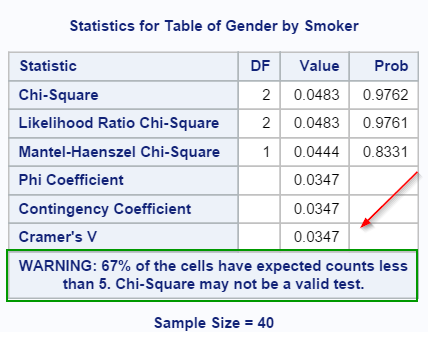
2. Chi-square Test Results
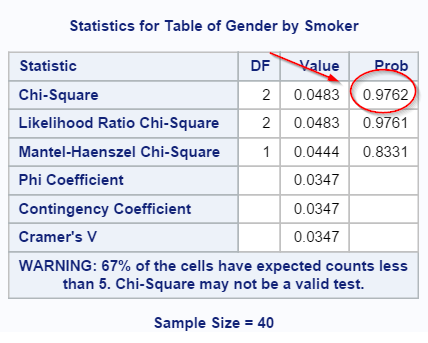
The p-value is 0.7241. There is not sufficient evidence to reject the null hypothesis.
We conclude that there is no significant difference in the smoking behavior between the two genders.
Assumption for Chi-square Test
One of the major assumptions for chi-square test is that each cell count has to be at least 5 or above.
In our example, some of the cell counts are less than 5:
A warning is shown on the chi-square table:
Fisher's Exact Test
When some of the cell counts are less than 5, the Fisher's Exact test is the better test for the hypothesis testing.
Example
Proc Freq Data=Smoke;
Table Gender * Smoker / Fisher;
Run;
When some of the cell counts are less than 5, the Fisher's Exact test is the better test for the hypothesis testing.
Example
Proc Freq Data=Smoke;
Table Gender * Smoker / Fisher;
Run;
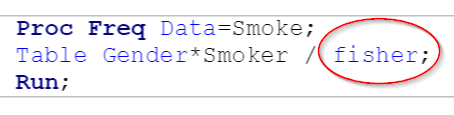
Similar to the chi-square test, simply add the keyword FISHER to the table statement to get the Fisher's exact test results:
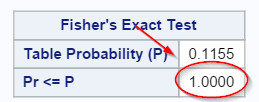
The p-value is very high. There is no significant difference between the two genders on the smoking behaviour.
Exercise
Copy and run the VOTER data set from the yellow box below:
Copy and run the VOTER data set from the yellow box below:
The VOTER data set contains the voting preference among the 3 income groups.
The income groups can be classified as "<70K", "70K to 120K" and ">120K".
Perform a statistical hypothesis test and find out if there is any significance difference in voting preference among the 3 income groups.
Need some help?
HINT:
A simple chi-square test should do.
SOLUTION:
Proc Freq Data=Voter;
Table Party*Income / chisq;
Run;
The p-value is 0.7375. There is no significant difference in voting preference among the 3 income groups.
Fill out my online form.