Search the site...

SASCRUNCH TRAINING
  • Home
  • Member's Area
  • How to Start
  • SAS Interface
  • Creating a Data Set
  • Practical SAS Training Course
  • SAS Certified Specialist Training Program
  • Proc SQL Course
  • Introduction to Time Series Analysis
  • SAS Project Training Course
  • Full Training / Membership
  • Sign up
  • About us
  • Contact us
Geo-targeting Project [29-25]


Let's directly compare the sales performance between the targeted stores and the rest of the stores.
proc sql;
create table final_results as
select target, 
       sum(total_sales_q1) as sum_q1,
       sum(total_sales_q2) as sum_q2,
       calculated sum_q2 / calculated sum_q1 - 1 format=percent. as incr_percent
from stat
group by target;
quit;
Did the code fail?

Copy and run the code below to create the input data sets.

The sales has gone up by an average of 6% for the targeted stores.

The rest of the stores weren't performing very well.

On average, the sales have gone down by about 5%.
Picture

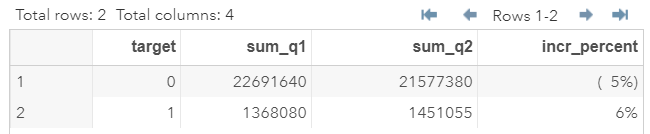
It is safe to say that the direct marketing campaign is a great success!
Next
Already a member? Go to member's area.