|
Churn Modeling [2-10]
Now, we are going to dive deeper into the data set and learn more about the distributions of the columns: proc means data=logistic_CS min p1 p5 p95 p90 p99 max mean std nmiss n mode;
run; The MEANS procedure above prints a list of statistics such as the minimum, maximum, the 99th percentile and the missing values, etc. 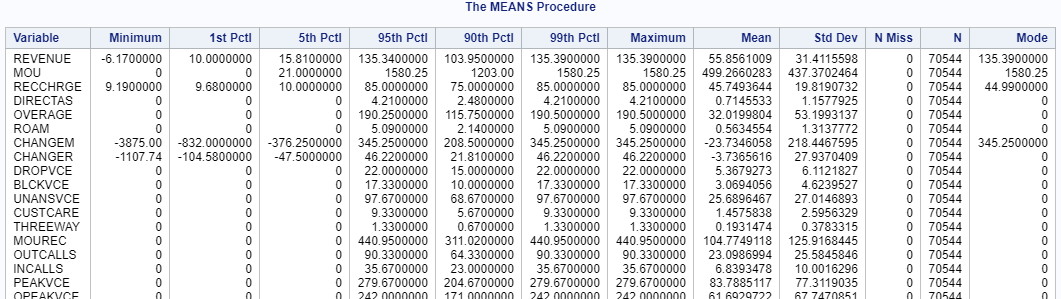
Note: unless you got some very sharp eyes, you will need to expand the browsing windows to look at the data :) There are two things we need to clean up before we run the logistic regression model:
Outliers The outliers are extreme values. They could severely skew the results. Let's look at an example. Copy and run the code in the yellow box below in your SAS Studio: The TEST data set contains a list of values with an extreme value at 100: 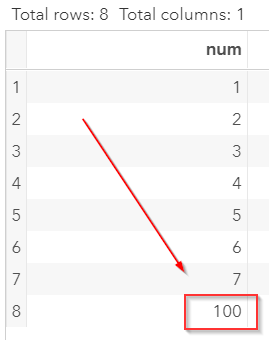
Let's take the mean of the column: proc means data=test mean; run; The mean is 16 which is significantly higher than the majority of the data point: 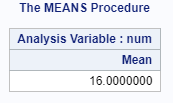
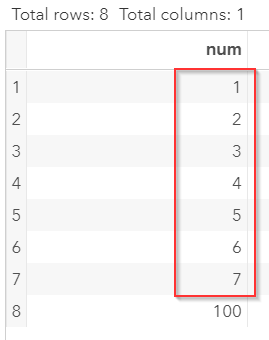
Identifying the Outlier It is easy to identify the outlier when you have just a few data points (such as the TEST data set above). It would be impossible to screen the outlier by eyes when you have tens of thousands of data. One way to identify the outliers is to find the 99th percentile of data. Below is an example: proc means data=test mean p99; run; This prints the 99th percentile on the results window: 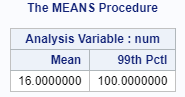
The extreme value (100) was identified! Now, we are going to systematically identify the extreme values for all of the numeric columns in our IMPORT data set. proc means data=import min p90 p95 p99 max; var _numeric_; run; This lists the 90th, 95th and 99th percentile of all of the numeric columns in our data set: 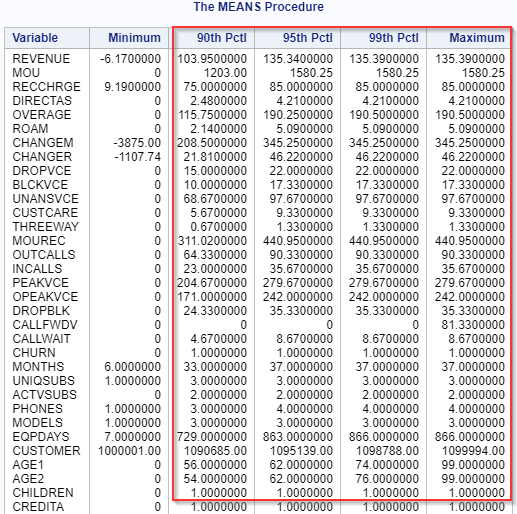
In terms of spotting outliers, we are going to ignore the variables where the values fall into either 0's or 1's. These are the binary variables and there can't possibly be any outliers since there are only 2 values! You can find the majority of them at the bottom of the variable list beside the SETPRC variable: 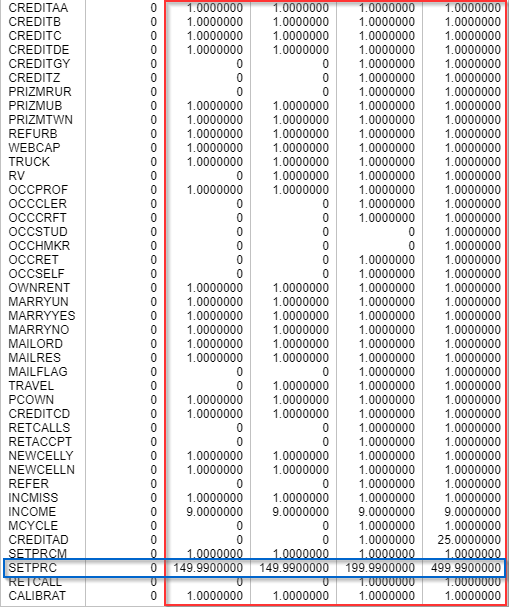
Now, let's quickly go through the non-binary columns. Most of the columns look fine beside the CALLFWDV (i.e. mean number of call forwarding calls) 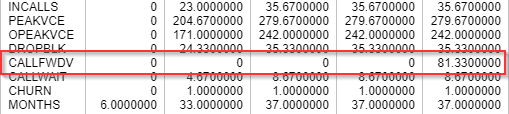
Almost all of the customers have zero call forwarding calls. However, there is one customer who had an average of 81 CFCs. Let's look at how many customers have non-zero call forwarding calls: proc sql; select CALLFWDV, count(customer) as n from import where CALLFWDV ^= 0 group by CALLFWDV order by CALLFWDV desc ; quit; The proc sql step above counts the number of customers for each CALLFWDV values: 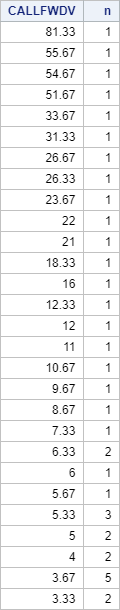
These are all outliers. The majority of the customers (99th percentile) do have have any CFCs. However, these outliers are legit. Maybe this is an important factor that identifies the churning customers? We have decided to keep the values without removing any of them. 
Should you drop the outlier? Whether to drop the outlier depends on your data. Is the outlier a data-entry error? Or is it a legitimate data point? Does it affect the analysis results? This article has a good explanation on when you should drop the outliers. By going through the list of columns, we have decided that no outlier needs to be removed. |