|
Geo-targeting Project [28-25]
Let's take a quick look at how the stores were performing in Q2: proc sql; create table stat1 as select store_postcode, sum(price) as total_sales_q1 from sales_q1 group by store_postcode order by store_postcode; quit; proc sql; create table stat2 as select store_postcode, sum(price) as total_sales_q2 from sales_q2 group by store_postcode order by store_postcode; quit; proc sort data=target; by store_postcode; run; data stat; merge stat1 stat2 target (in=c); by store_postcode; if c then target = 1; else target = 0; format increase percent.; increase = total_sales_q2 / (total_sales_q1) - 1; run; Did the code fail?
Copy and run the code below to create the input data sets. The STAT table shows the sales for Q1 and Q2 across the 15 stores: 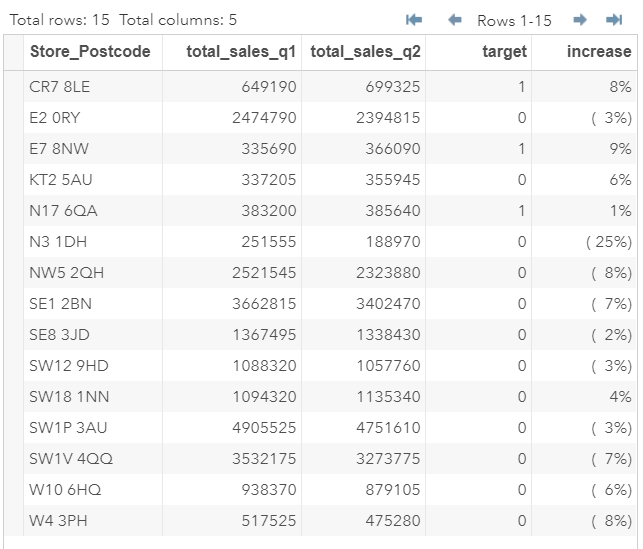
The TARGET column identifies the stores we selected for the direct marketing campaign.
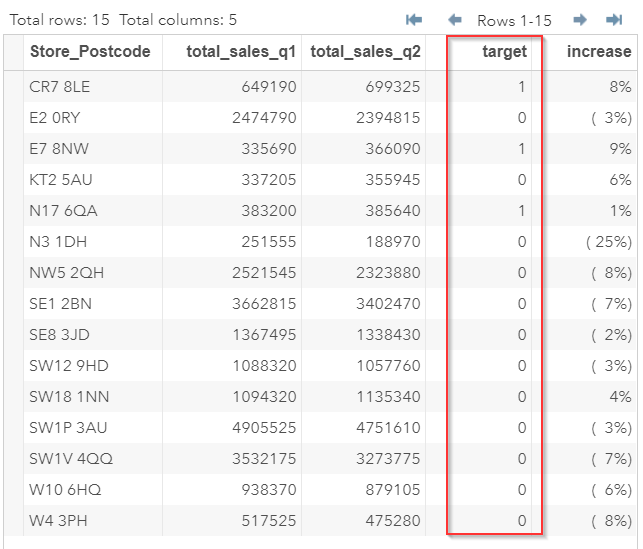
The stores selected for the direct marketing campaign have outperformed the rest of the stores. 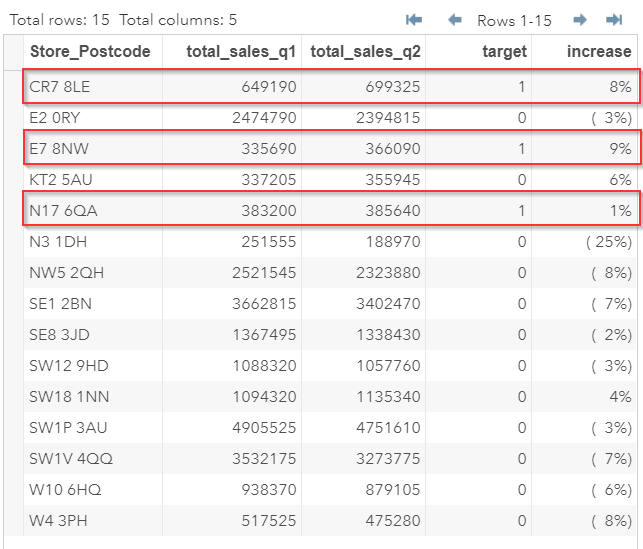
The three selected stores reported a sales increase of 8, 9 and 1%. The rest of the stores are mostly negative in the increment column. |