|
Churn Modeling [1-10]
Let's first take a look at the data we have. proc contents data=import varnum; run; The CONTENTS procedure prints the descriptor portion of the data set. As mentioned, we have 78 columns with 71,047 rows of data in the data set: 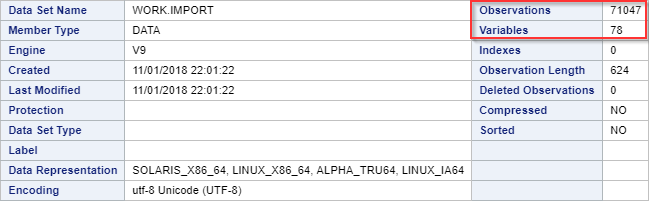
The 78 columns are listed at the bottom: 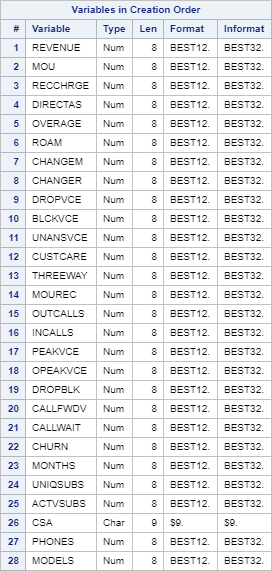
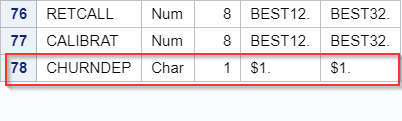
The majority of the columns are numeric except for CSA and CHURNDEP. 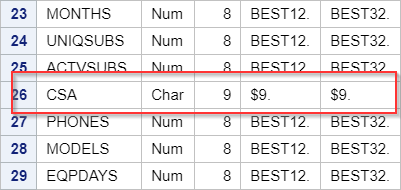
Let's look at the data dictionary to learn more about each column. 
The data dictionary has a brief description for each column. Let's look at some examples:
You can read more on the data dictionary for the rest of the columns. When you go through the list of columns, you will see the CUSTOMER columns in column 30 in the data dictionary: 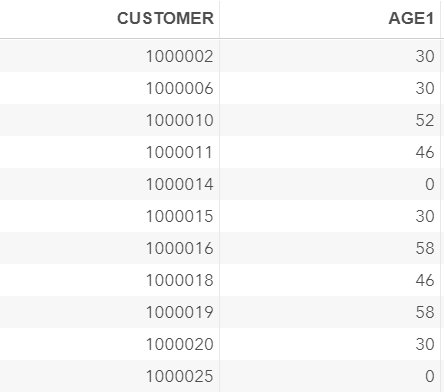
The data is captured on the customers level with each record representing the details of the usage and charges for each customer. 
Programming Tips In a telecom database, the data is usually captured on many different levels. Some data sets capture data on the transaction level where each record represents a single transaction at a given time point. Other data sets capture data on the customer level where each row represents a unique customer profile. There are also tables containing the daily snapshot of the customers usage information. It is important to understand the data table structure before performing any manipulation and statistical analysis. |