Sentry Page Protection
Time Series Modeling
[2-15]
[2-15]
Let's suppose you are told to forecast the sales after the 60-day period.
As a forecaster, there are many things that you want to look at.
One thing you might want to look into is whether the sales are different on different days of the week.
Maybe the sales are higher on Fridays and lower on Tuesdays?
These are the seasonal patterns that you want to look into.
Now, let's look at the DAY column from the SALES data set.
If you haven't created the SALES data set, copy and run the code from the yellow box below:
The DAY column contains the information about the day of the week:
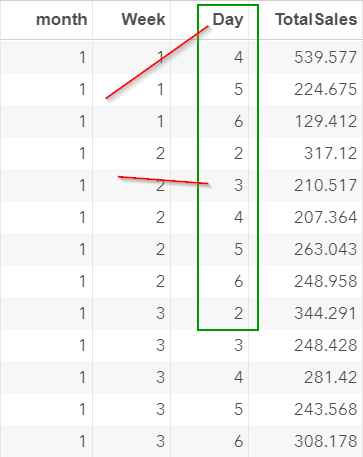
The DAY column contains values from 2 to 6 where:
- 2 = Monday
- 3 = Tuesday
- 4 = Wednesday
- 5 = Thursday
- 6 = Friday
Let's calculate the average sales for each day of the week:
proc means data=sales;
var totalsales;
class day;
run;
var totalsales;
class day;
run;
The MEANS procedure summarizes the total sales from Monday to Friday.
From the table, you will have noticed that Monday's sales are substantially higher than other days!
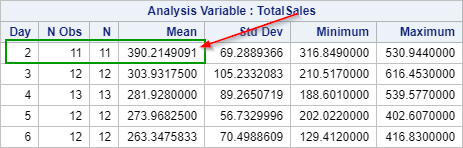
The average sales on Monday is $390. Tuesday has the second highest average sales at $303. The rest of the week does not even reach $300.
Now, let's fit an ANOVA model to test the difference between the average sales from Monday to Friday.
proc anova data=sales;
class day;
model totalsales = day;
run;
class day;
model totalsales = day;
run;
Below are the results:
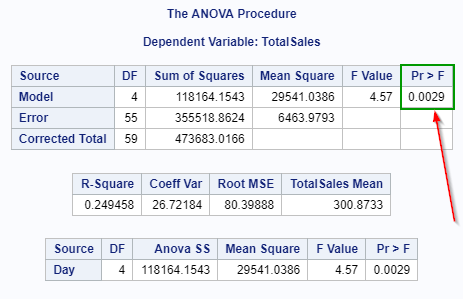
The p-value for the F test is 0.0029, which is less than 0.05.
We reject the null hypothesis that the average daily sales are the same across the week.
The average sales on some days are significantly different than others.
Now, let's look at the distribution plot (created by the ANOVA procedure):
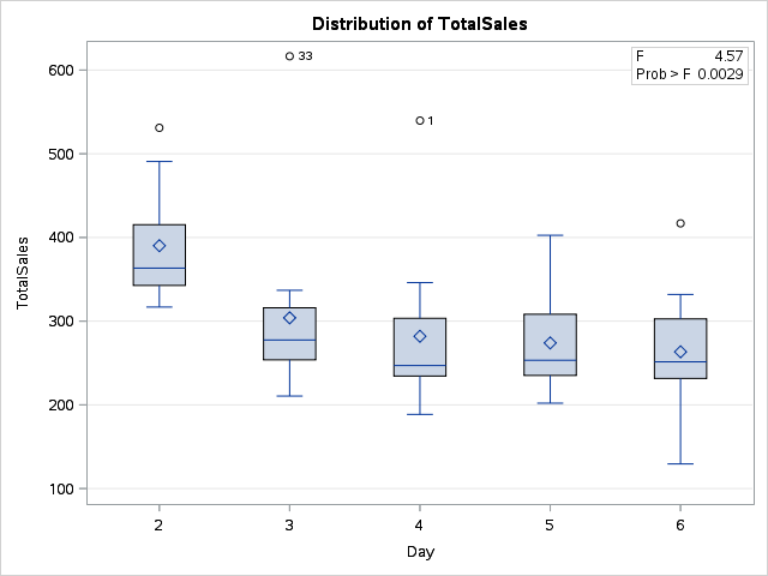
The result is consistent with our previous findings.
The store is closed on weekends, which could be the reason why Monday's sales are higher than other days.
The findings indicate that there is a seasonal cycle every week.
The sales on Monday are, on average, higher than the rest of the week.
We are going to make use of this information when building our final model.
In the next section, we will look at how to properly set the TIME variable for the x-axis.
Exercise
Are there any significant differences in sales between the different weeks of the month?
Create a frequency table for the total sales for each week of the month.
In addition, fit an ANOVA model, and test the difference in sales between five weeks of the month.
Are there any significant differences in sales between the different weeks of the month?
Create a frequency table for the total sales for each week of the month.
In addition, fit an ANOVA model, and test the difference in sales between five weeks of the month.
Need some help?
Fill out my online form.