Sentry Page Protection
Time Series Modeling
[3-15]
[3-15]
Before we fit any time series model to our data, we must first ensure the observations are in sequential order with equal intervals.
Let's look at how the data is ordered in the SALES data set.
If you haven't created the SALES data set, copy and run the code from the yellow box below:
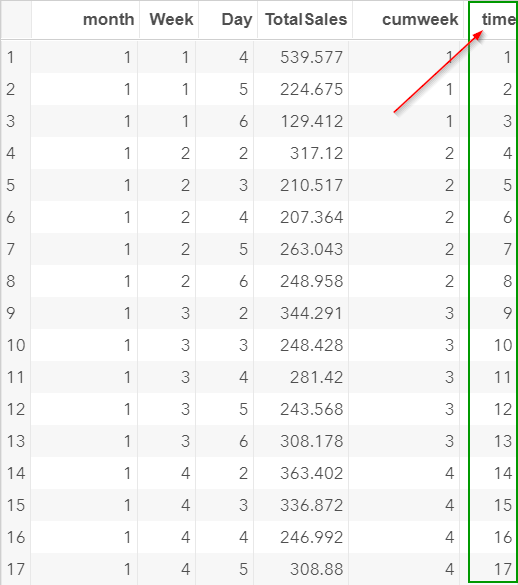
The observations in the SALES data set are ordered by the MONTH, WEEK and DAY columns.
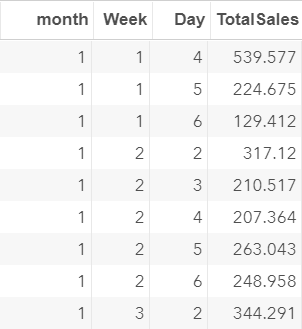
Again, the DAY column contains five values:
- 2 = Monday
- 3 = Tuesday
- 4 = Wednesday
- 5 = Thursday
- 6 = Friday
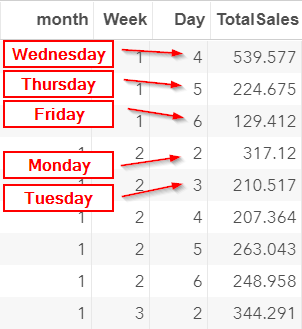
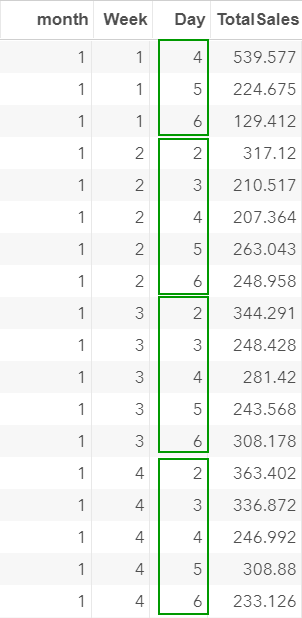
The observations are ordered by days. Weekends are not included.
The series seems to be in sequential order, which is good.
However, we need to ensure there are no missing days during the entire period.
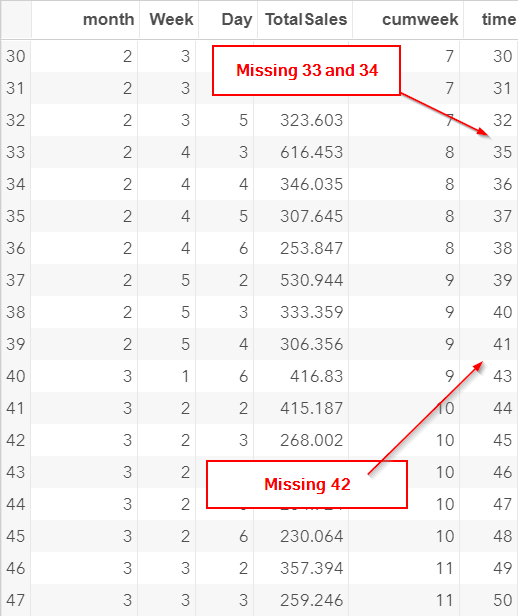
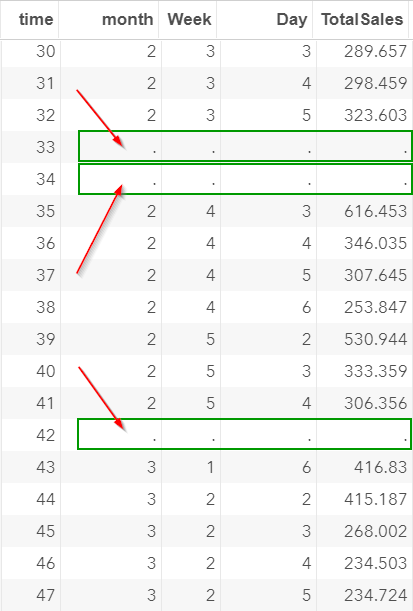
Let's scroll down to row 32.
The (6=Friday) and (2=Monday) are missing after row 32.
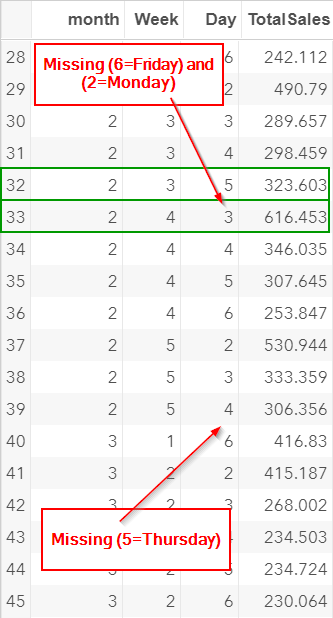
In addition, (5=Thursday) is missing after row 39.
The missing days are likely due to holidays when the store is closed.
We must insert the observations for these missing days to ensure equal intervals in the time column.
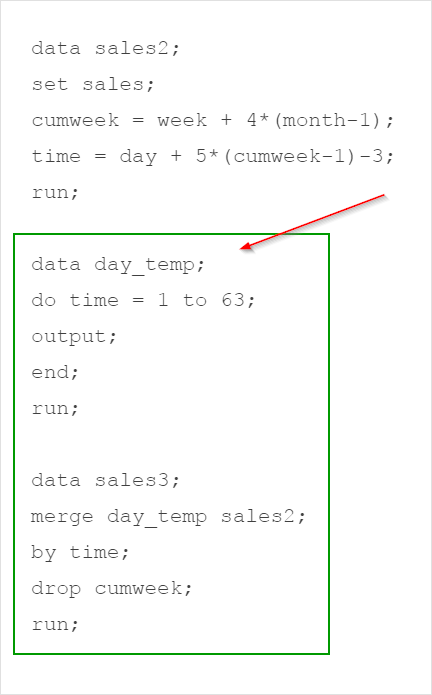
Let's run the code below:
data sales2;
set sales;
cumweek = week + 4*(month-1);
time = day + 5*(cumweek-1)-3;
run;
data day_temp;
do time = 1 to 63;
output;
end;
run;
data sales3;
merge day_temp sales2;
by time;
drop cumweek;
run;
set sales;
cumweek = week + 4*(month-1);
time = day + 5*(cumweek-1)-3;
run;
data day_temp;
do time = 1 to 63;
output;
end;
run;
data sales3;
merge day_temp sales2;
by time;
drop cumweek;
run;
The first data step creates a TIME column that lists the observations in sequential order.
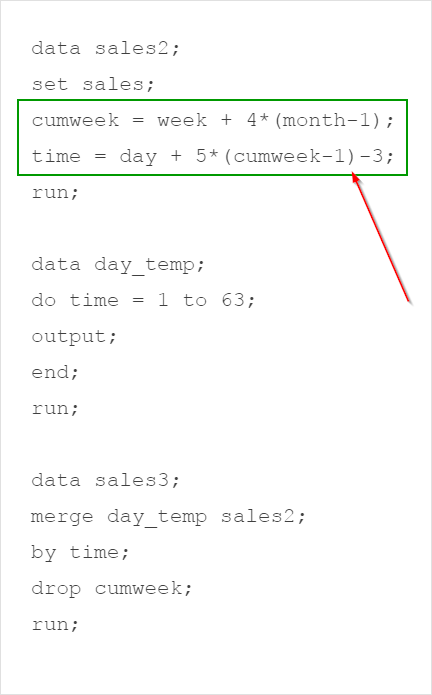
However, the missing time points are not inserted into the data set yet.
If you scroll down, you will see that we are missing time observations 33, 34 and 42:
The second and third data steps insert the missing observations into the data set.
Open the SALES3 data set.
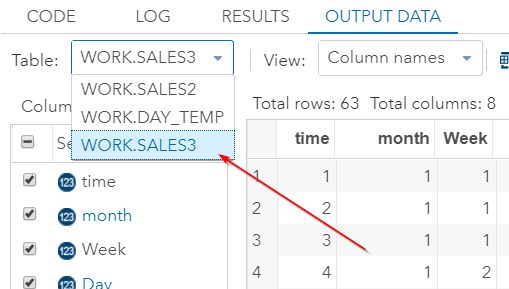
You will see that the data set now contains the observations for the missing days.
The observations are now ordered sequentially, with equal intervals.
In the next section, we will look into the concept of autocorrelation, which is extremely important for time series analysis.
Exercise
A co-worker of yours argues that you do not need to fill in the observations for the missing days.
She claims that you can simply perform the time series modeling by treating each observation as an individual time point.
Below is her code:
data coworker;
set sales;
time = _n_;
run;
The TIME column is shown below:
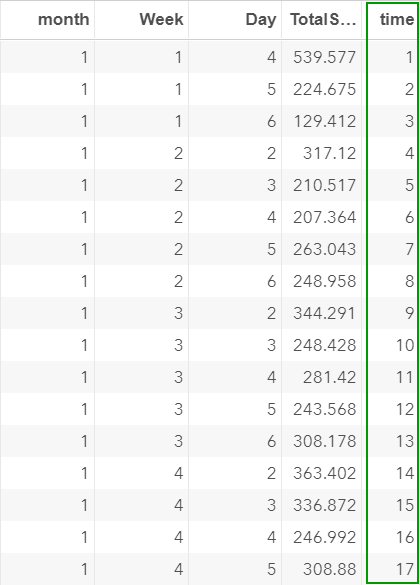
The time column goes from 1 to 60 for each of the 60 observations, with no rows added for the missing days.
Is there any issue using this column as your x-axis?
Why and why not?
Need some help?
Fill out my online form.