Sentry Page Protection
Time Series Modeling
[4-15]
[4-15]
Time series forecasting is about using the past data to predict the future.
However, does the past value really have any forecasting power?
If the sales on Tuesday is $300, should we expect the sales on Wednesday to be roughly the same?
What about the sales on Thursday?
In order to build a reliable model for sales forecasting, we must learn more about the relationship between the sales at the different time points.
Let's look at an example.
If you haven't created the SALES3 data set, copy and run the code from the yellow box below:
Autocorrelation
The autocorrelation is a measure of the correlation between a variable and the lagged values of itself.
Let's look at the example below.
Autocorrelation
The autocorrelation is a measure of the correlation between a variable and the lagged values of itself.
Let's look at the example below.
data ex1;
set sales3;
prev = lag(totalsales);
keep time totalsales prev;
run;
set sales3;
prev = lag(totalsales);
keep time totalsales prev;
run;
The PREV column contains the lagged value of the total sales, which is the sales from the previous day.
For example, the PREV is $539.577 at time 2. This is the total sales at time 1.
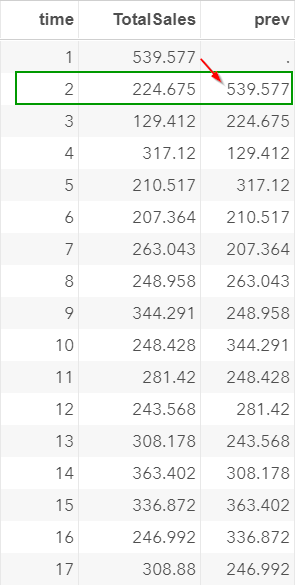
We now have two columns.
The TOTALSALES column contains the sales over the 60-day period.
The PREV column contains the previous day's sales in each time point.
We are going to compute the autocorrelation between them and find out how correlated they are.
If the two columns are highly correlated, that would be the hint that you can use the previous day's sales to predict the current day's sales.
SAS does not have a built-in option to calculate the autocorrelation.
Below is the macro that does the calculation:
%macro autocorr (in=,var=,lag=);
proc sql noprint;
select mean(&var) into :average from ∈
quit;
data autocorr;
set ex1 end=eof;
a = &var;
c = lag&lag.(a);
a1 = (a-&average);
a2 = (c-&average);
a3 = a1*a2;
a4 = (a-&average)**2;
s3 + a3;
s4 + a4;
r = s3/s4;
if eof = 1;
keep r;
run;
%mend;
proc sql noprint;
select mean(&var) into :average from ∈
quit;
data autocorr;
set ex1 end=eof;
a = &var;
c = lag&lag.(a);
a1 = (a-&average);
a2 = (c-&average);
a3 = a1*a2;
a4 = (a-&average)**2;
s3 + a3;
s4 + a4;
r = s3/s4;
if eof = 1;
keep r;
run;
%mend;
Note: the macro itself does not generate any result. It is simply a memory of the code that can be executed once it is called.
Now, let's call the AUTOCORR macro that we have just created.
%autocorr(in=ex1, var=totalsales, lag=1);
Calling the macro is easy!
You just have to specify the three parameters below:
- IN: the input data set. In our example, it is the EX1 data set.
- VAR: the variable of interest. In our example, it is TOTALSALES.
- LAG: a number that specifies the lag you want to compute for the autocorrelation.
Note: the macro is quite versatile. It can calculate the autocorrelation for more than one lag. We will look at some examples shortly.
The macro computes the autocorrelation between TOTALSALES and its lagged values.
The autocorrelation is 0.05536
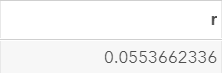
The autocorrelation between the current day's sales and the previous day's sales is very weak.
We can't seem to rely on the previous day's sales to forecast the current day's sales.
This is going to be useful when we build our final model.
Now, what about the correlation between the current sales and the sales from two days prior?
Maybe the sales on Tuesday are correlated with the sales on Thursday?
This is worth investigating.
We will again use the AUTOCORR macro to compute the autocorrelation at lag=2:
Maybe the sales on Tuesday are correlated with the sales on Thursday?
This is worth investigating.
We will again use the AUTOCORR macro to compute the autocorrelation at lag=2:
%autocorr(in=ex1, var=totalsales, lag=2);
The autocorrelation computed is -0.0797.
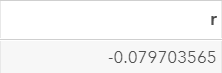
This is again a very weak autocorrelation.
The current day's sales does not seem to depend on the sales from two days ago.
The concept of autocorrelation is very important.
In the next section, we will create the Autocorrelation Function (ACF) plot, which plots the autocorrelation at different lagged time points.
Exercise
Calculate the autocorrelation of TOTALSALES at lag 3.
You can use the AUTOCORR macro to compute the autocorrelation.
Calculate the autocorrelation of TOTALSALES at lag 3.
You can use the AUTOCORR macro to compute the autocorrelation.
Need some help?
Fill out my online form.